
FIGURE 1.
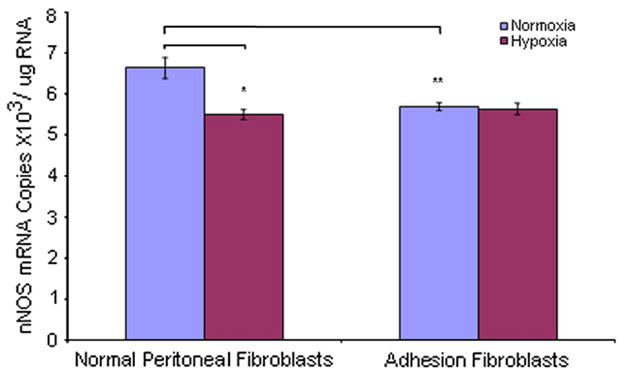
Comparison of nNOS mRNA levels in human normal peritoneal (n = 5) and adhesion fibroblasts (n = 5) before and after hypoxia (2% O2) treatment.
*P<.005, ** P<.005 vs. normal peritoneal fibroblasts cultured under normoxic conditions. Results are representative of the mean of three independent experiments.