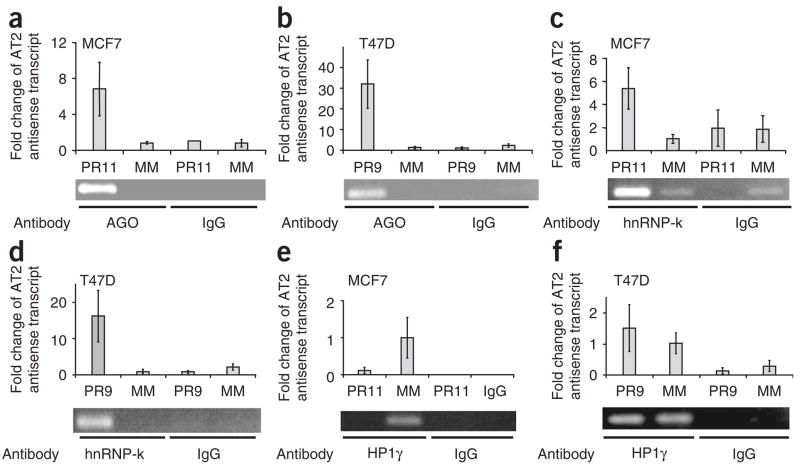
Figure 5.
Association of AGO proteins, hnRNP-K and HP1γ with PR antisense transcript AT2 examined by RIP. Fold changes in qPCR values are relative to the results of treatment with mismatched RNA. (a) RIP of PR antisense transcript in MCF7 cells using an anti-AGO antibody after treatment with mismatch-containing RNA (MM) or activating agRNA PR11. (b) RIP of PR antisense transcript in T47D cells using an anti-AGO antibody after treatment with mismatch-containing RNA or inhibitory agRNA PR9. (c) RIP of PR antisense transcript in MCF7 cells using anti–hnRNP-k antibody after treatment with mismatch-containing RNA or activating agRNA PR11. (d) RIP of PR antisense transcript in T47D cells using an anti–hnRNP-k antibody after treatment with mismatch-containing RNA or inhibitory agRNA PR9. (e) RIP of PR antisense transcript in MCF7 cells using an anti-HP1γ antibody after treatment with mismatch-containing RNA or activating RNA pdPR11. (f) RIP of PR antisense transcript in T47D cells using an anti-HP1γ antibody after treatment with mismatch-containing RNA or inhibitory RNA agPR9. RIP data are from a representative experiment chosen from three similar data sets. Error bars for RIP data represent s.d. calculated from quadruplicate qPCR measurements for each.

