
Figure 3.
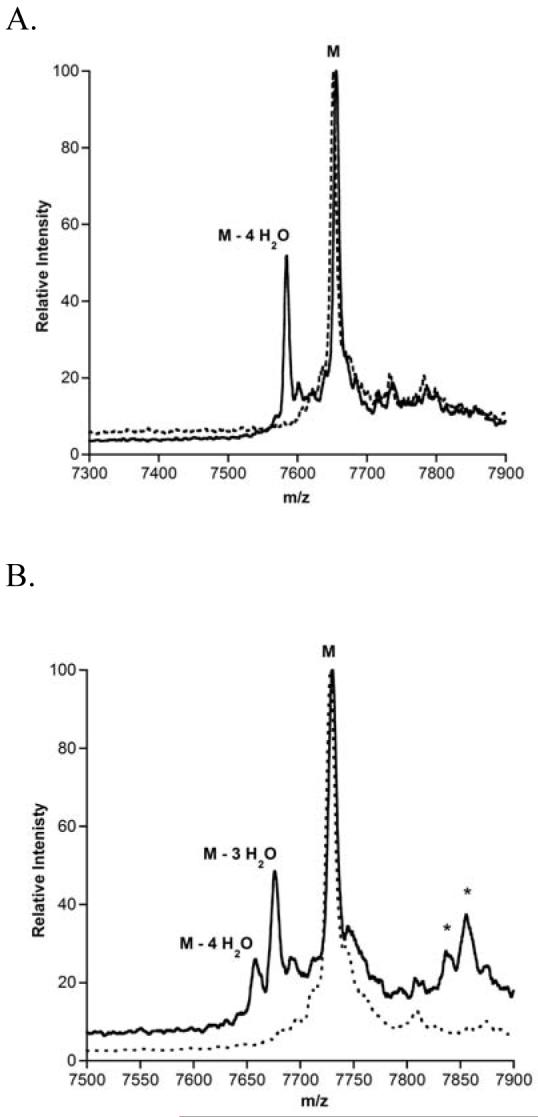
Representative MALDI-TOF mass spectra of LctA leader mutants before (dashed line) and after (solid line) incubation with LctM. Reactions were stopped after 10 min to compare relative efficiencies of product formation, (A) LctA E-8A, (B) LctA L-7E. The (*) indicates phosphorylated peptides (50).