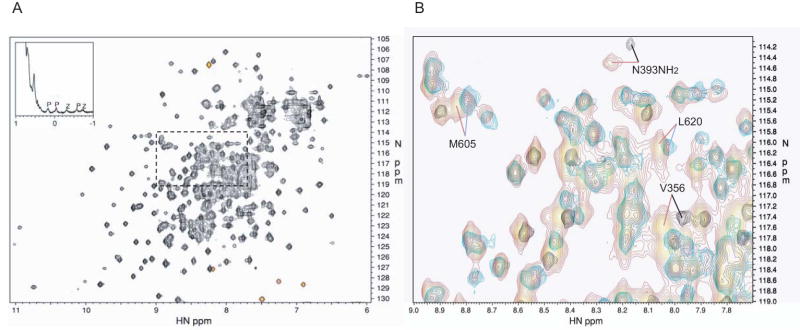
Figure 1. NMR spectrum of the PZA construct of ASAP1. A. 2D 15N HSQC spectrum.
The 2D 15N HSQC spectrum of 2H/15N labeled PZA is shown, with a region of the 1D spectrum of natural abundance PZA shown in the inset. The red signals are folded, with frequencies lying outside the 15N spectral width. The 1D spectrum shows the upfield methyl region. Methyl resonances belonging to the PH and ZA domains are indicated by P and Z, respectively. B. Overlay of spectra. Region expanded from A), indicated by the (dashed?) box, showing the overlay of the 15N HSQC spectrum of the full-length PZA construct (red) with those of the PH domain alone (black) and ZA construct (blue). Four chemical shift changes of particular interest are indicated. The backbone amide of V356 shows the largest change in the PH domain alone compared to the full-length PZA construct. The ZA construct residues M605 and L620 are too far from the domain N-terminus to make contact with the inter-domain linker, and so these chemical shift changes are evidence of contact between the ZA and PH domains. Many side chain amide signals also show significant differences; here, the change for one of the amide signals for the side chain of N393 in the PH domain is indicated.

