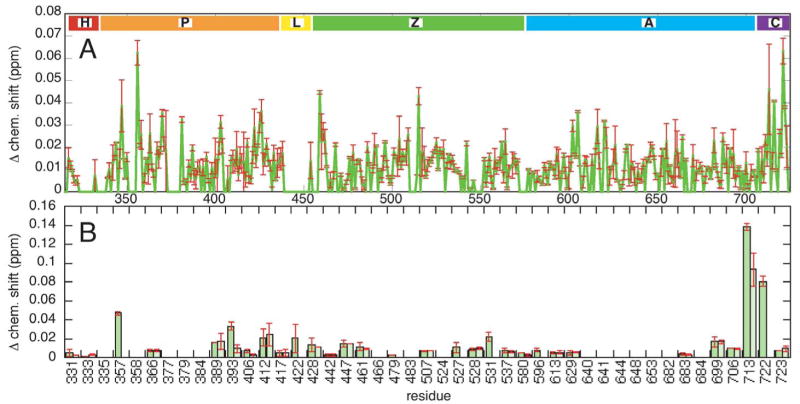
Figure 2. Chemical shift differences between PZA and the PH and ZA. A. Backbone amides.
Backbone amide chemical shift differences as a function of residue number with error bars resulting from two separate measurements. The residue regions indicated correspond to H: his tag, P: PH domain, L: linker region, Z: Arf GAP domain, A: ankyrin repeat domain, and C: c-terminal tail. B. Side chains amides. Side chain amide chemical shift differences with each side chain residue number indicated and with error bars as in A).

