
Figure 8. Model structure of the PH/ZA complex. A. Ensemble of possible PH domain locations compatible with the NMR results.
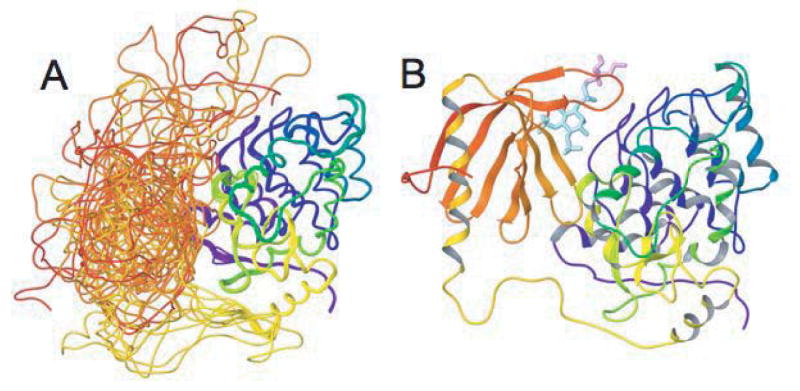
In this ribbon diagram the PH domain is red to orange, the linker region yellow, and the ZA domain yellow-green to blue. B. Representative member of the ensemble including bound PIP2 diC4. The region of PIP2 diC4 shown in blue corresponds to IP3, and the pink region shows the glycerol and butanoyl groups. The pink star indicates residue 406 in the PH domain.