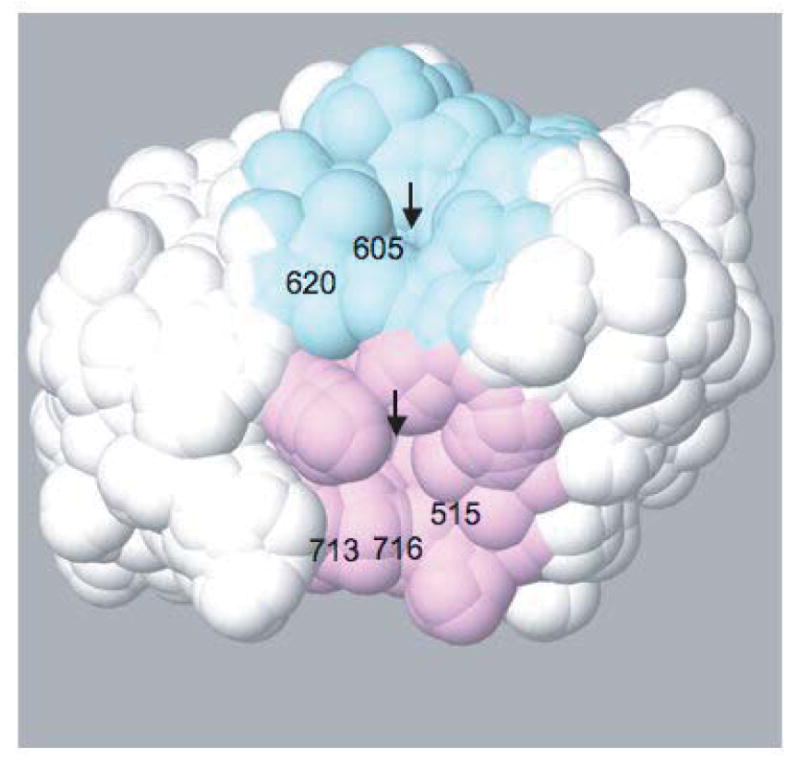
Figure 9. Surface of the PH domain interaction region of the ZA domain.

The two concave regions near the sites of largest chemical shift perturbations, with residue numbers indicated, are shown in pink and blue. The arrows indicate the narrow pockets at the center of each region. The angle of view in this figure is similar to that of Figure 3B.
