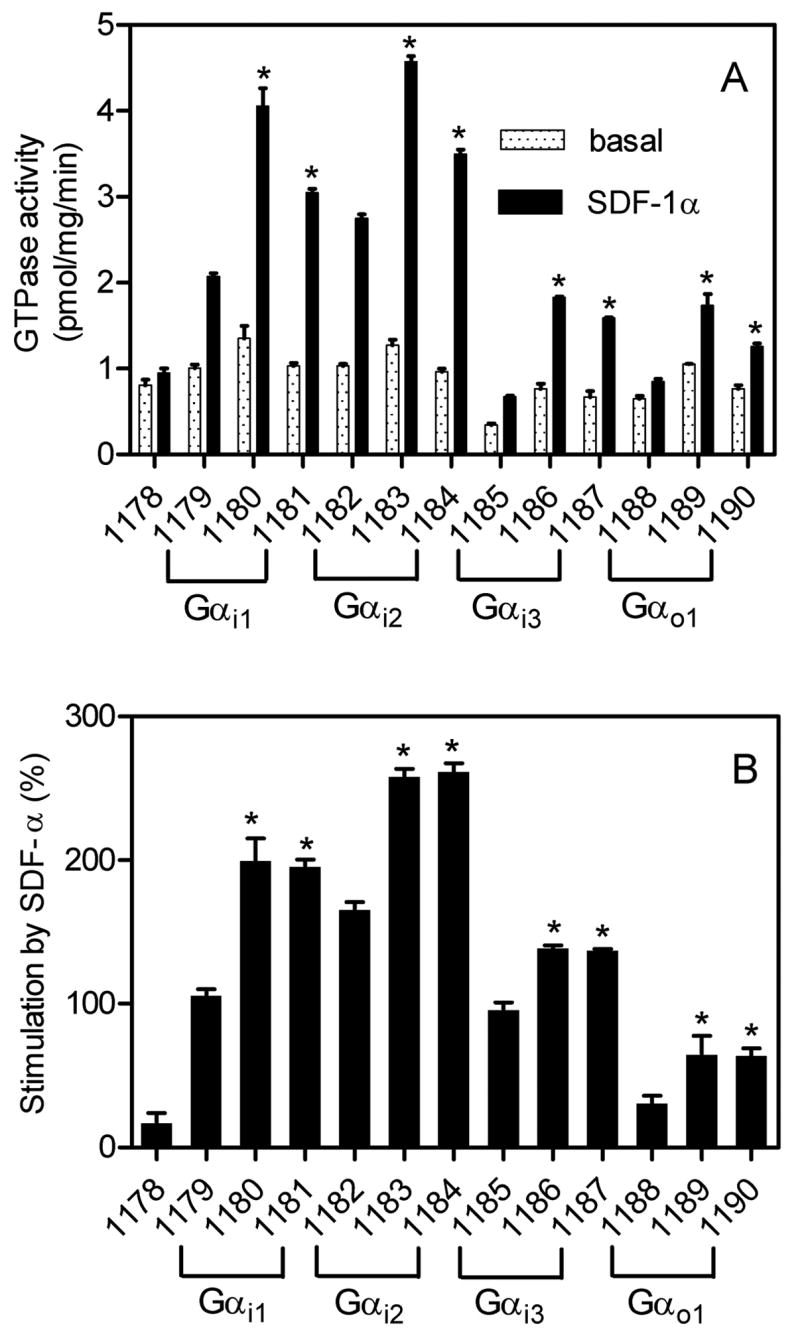
Fig. 3. Comparison of basal and SDF-1α-stimulated GTPase activity in various CXCR4-expressing Sf9 membranes.

High-affinity GTPase activity was determined as described in Materials and Methods. Numbers below columns designate the specific membrane studied (see Table 1 for specific protein composition). A, absolute GTPase activities under basal conditions (0.2% (m/v) BSA) or in the presence of a maximally stimulatory concentration of SDF-1α (50 nM). B, relative stimulatory effect of SDF-1α. Data shown are the means ± SD of three independent experiments performed in duplicates. The statistical significance of the effects of RGS-proteins RGS4 and GAIP versus control on SDF-1α-stimulated GTP hydrolysis was assessed using the t-test. *, p < 0.05.
