
Figure 5. Myocd induces SMC-like myofilaments in BC3H1 cells.
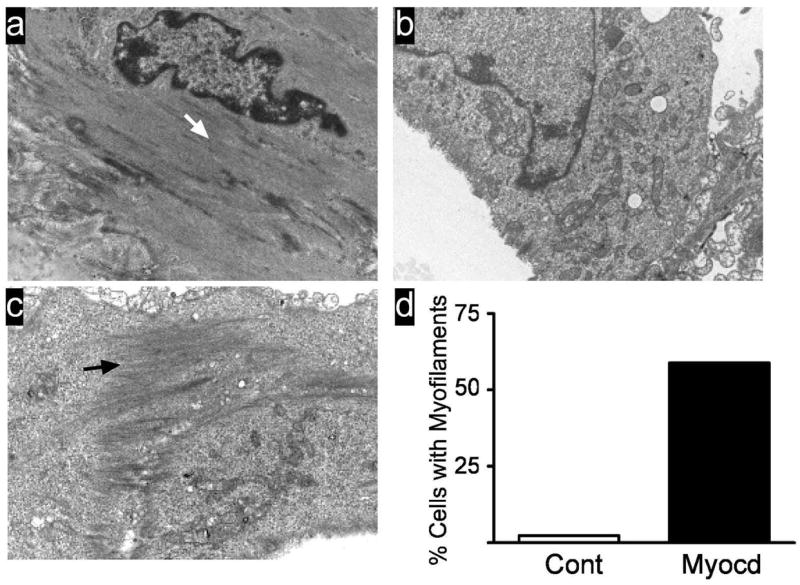
A. Ultrastructure of in vivo mouse aortic SMC showing myofilament array (white arrow). B. BC3H1 cells transduced with control adenovirus. C. BC3H1 cells transduced with Myocd. Note bundle of smooth myofilaments (black arrow). Magnifications, 15,000x . D. Quantitative measure of smooth myofilaments. Data represent semi-quantitative scoring (see Supplemental Methods at http://atvb.ahajournals.com) of more than 80 cells from two independent experiments.