
Figure 6. Myocd-induces SMC-like contraction.
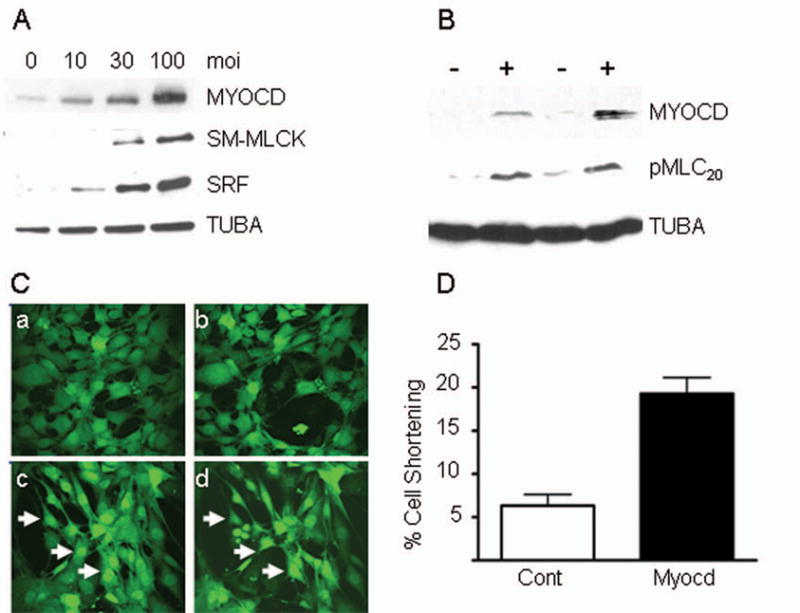
A. Expression of SM proteins in BC3H1 ± increasing amounts of Myocd adenovirus. B. Expression of pMLC20 in BC3H1 ± Myocd. C. Control-transduced BC3H1 cells (a, b) and Myocd-transduced cells (c, d) before (a, c) and after (b, d) 8 minute stimulation with 75 mM KCl. Arrows point to cells exhibiting changes in cell size. D. Quantitative measureof contractility in contro l- vs Myocd-transduced BC3H1 cells.