
Figure 3. Brain regional expression of Epb4.1l2 and Kcnb1.
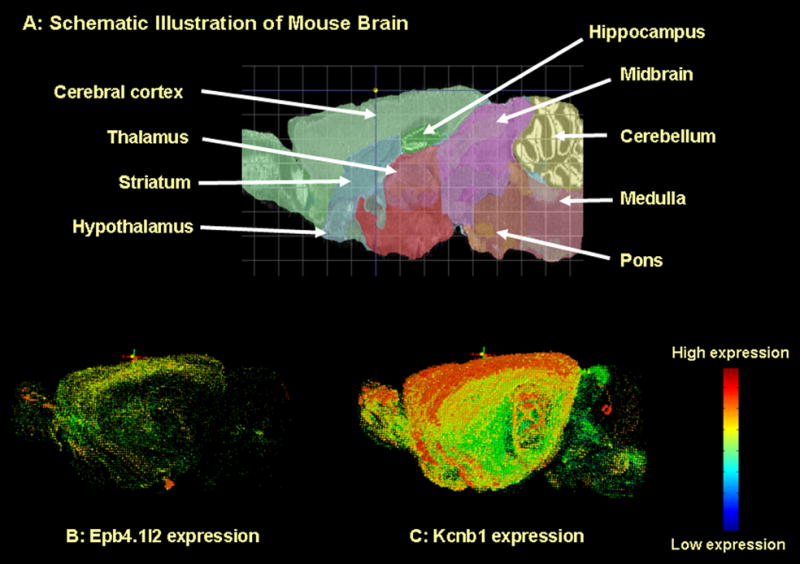
Data were obtained from the Allen Brain Atlas (http://www.brain-map.org). Panels B and C illustrate the expression of Epb4.1l2 and Kcnb1. The images were obtained by using software (Brain Explorer 1.4.1) available on site. The images are 3-dimensional reconstructions of data obtained from coronal and sagittal sections.