
Figure 4. Western blot for Kcnb1 in HAFT1/LAFT1 mouse brains.
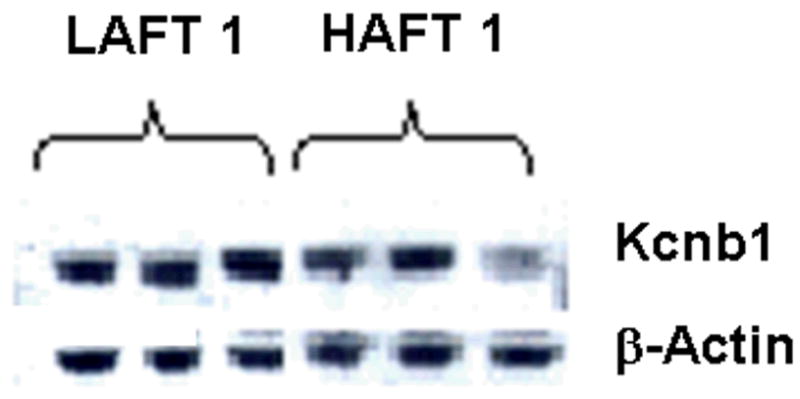
This figure illustrates the bands evident after probing the transfer with antibody for Kcnb1 and actin. Densitometric quantitation of the bands was performed using Quantity One (Bio-Rad, Hercules, CA) and the values appear in Table 5.