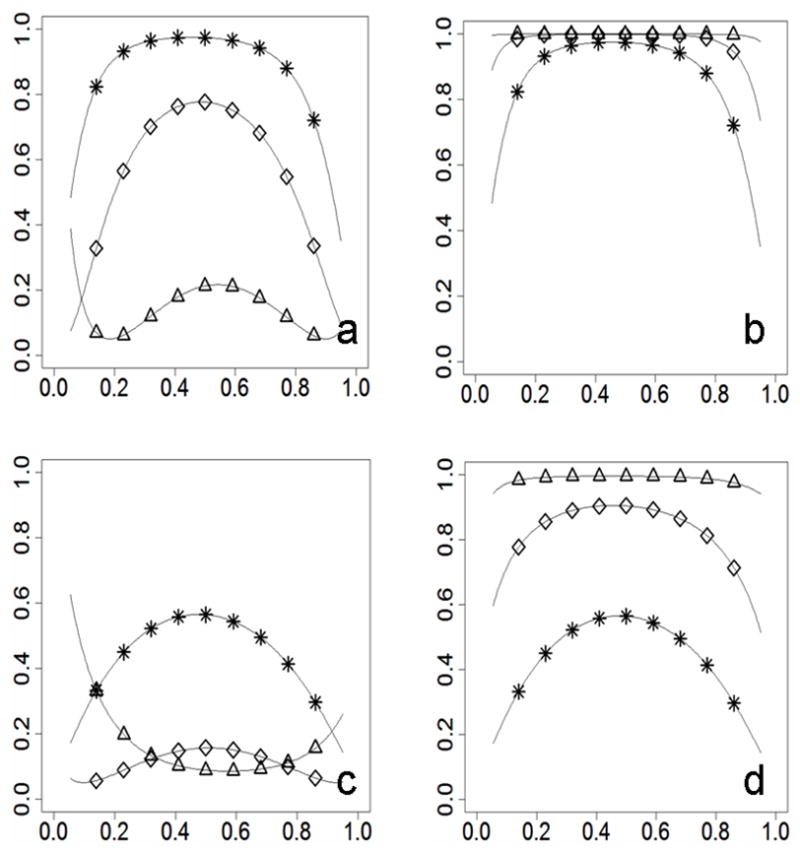
Figure 1.

Power differences in two-subpopulation scenarios without adjustment for type I error (statistical power on the y-axis; risk allele frequency on the x-axis). For Figures 1a and 1b, RR=1.4. For Figures 1c and 1d, RR=1.2. Figures 1a and 1c show patterns when the prevalence and the risk allele frequency are correlated negatively between subpopulations (prevalence_A=0.02, prevalence_B=0.06, frequency_A≥frequency_B). Figures 1b and 1d show patterns when the prevalence and the risk allele frequency are correlated positively between subpopulations (prevalence_A=0.06, prevalence_B=0.02, frequency_A≥frequency_B). Curves are marked for different divergence levels (* for Fst=0, ⋄ for Fst=0.01, Δ for Fst=0.05).
