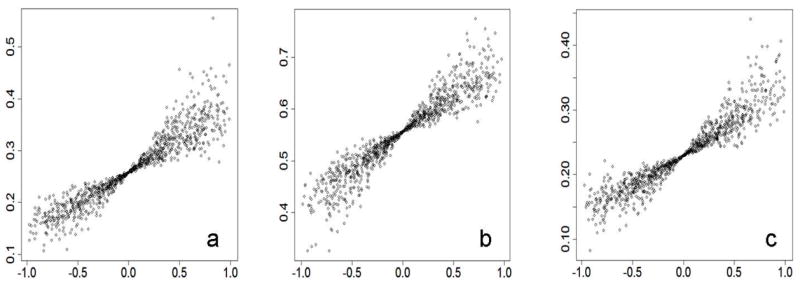
Figure 2.

Correlation between prevalence and risk allele frequency contributes to statistical power. The correlation is shown on the x-axis as Pearson’s coefficient, and statistical power is shown on the y-axis without adjustment for type I error. Suppose five subpopulations are of the same size in a local area and the RR of a risk allele is 1.2 in the local population. The Figure 2a shows results for a risk allele with frequency of 0.1 in the local population; the Figure 2b shows results for a risk allele with frequency of 0.5 in local population; the Figure 2c shows results for a risk allele with frequency of 0.9 in the local population.
