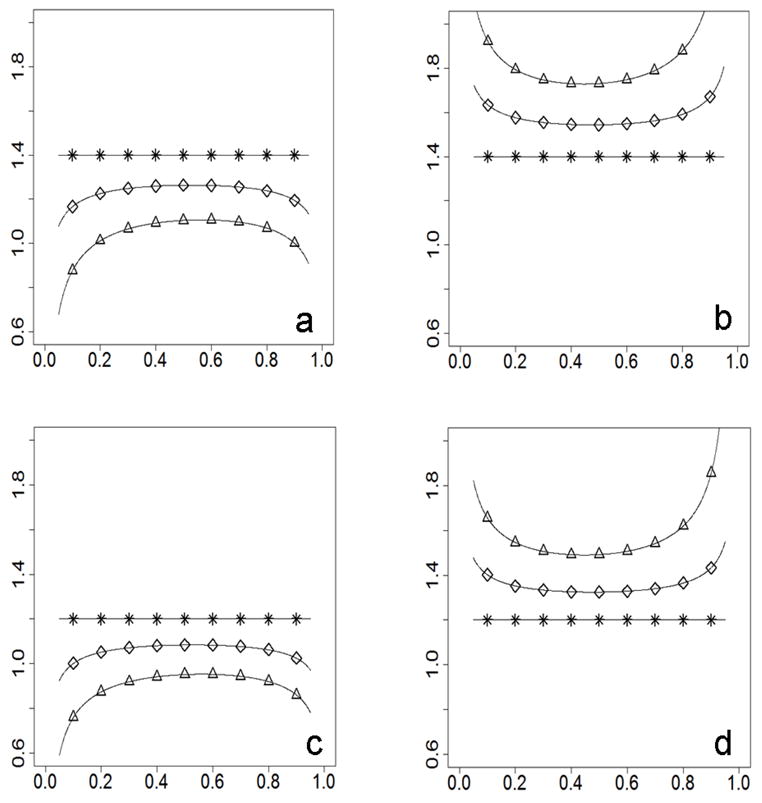
Figure 3.

Bias of observed RR on the y-axis; risk allele frequency on the x-axis). For Figures 3a and 3b, RR=1.4. For the Figures 3c and 3d, RR=1.2. Figures 3a and 3c show patterns when the prevalence and the risk allele frequency are correlated negatively between populations (prevalence_A=0.02, prevalence_B=0.06, frequency_A ≥ frequency_B). Figures 3b and 3d show patterns when the prevalence and the risk allele frequency are correlated positively between populations (prevalence_A=0.06, prevalence_B=0.02, frequency_A ≥ frequency_B). Curves are marked for different divergence levels (* for Fst=0, ⋄ for Fst=0.01, Δ for Fst=0.05).
