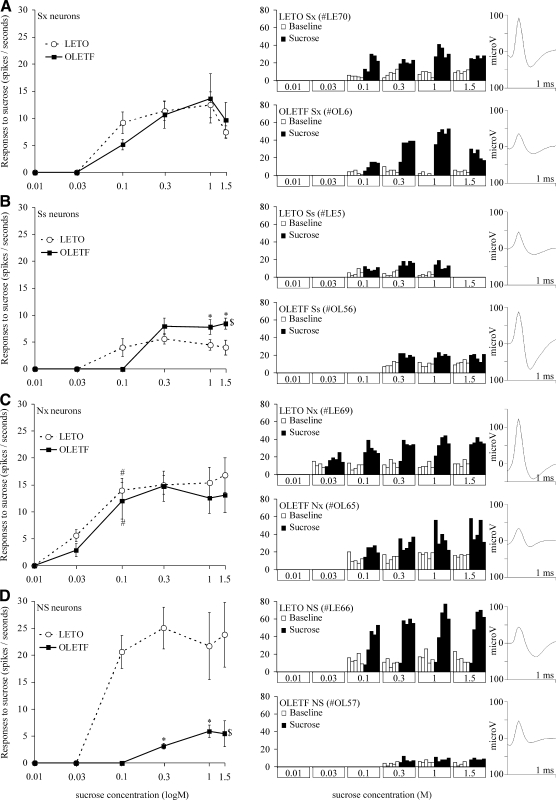
FIG. 7.
Mean corrected neuronal response magnitudes to various concentrations of sucrose (left) representative individual neuronal responses (middle) and corresponding action potential waveform (right). A: broadly tuned main band (Sx); B: narrowly tuned main band (Ss); C: broadly tuned side band (Nx); D: narrowly tuned side band (NS) sucrose-sensitive neurons. $, statistical differences between strains based on overall ANOVA; *, statistical differences between strains for a particular concentration; #, statistical difference between the actual and the former sucrose response magnitude within the same strain. For the actual values and comparisons, see results.

