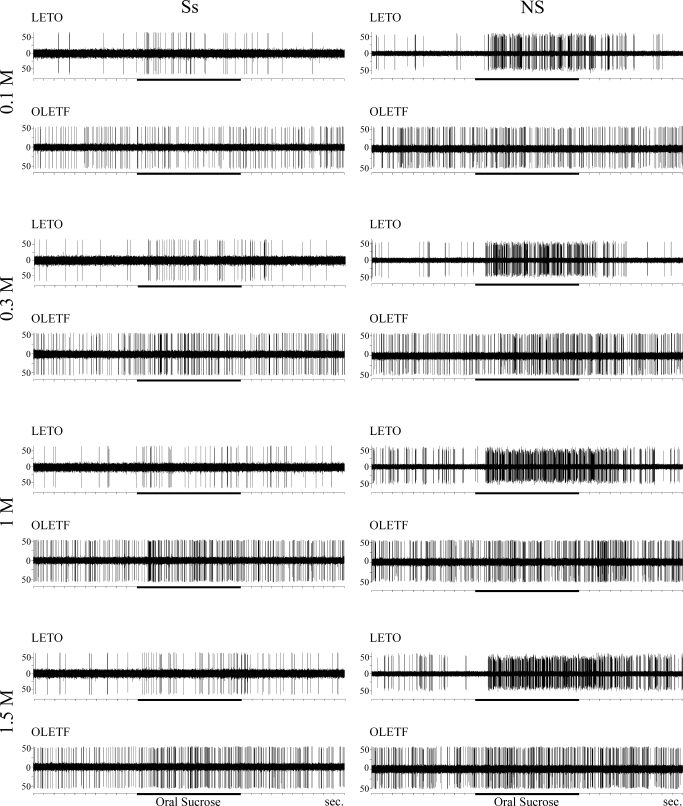
FIG. 8.
Representative recording traces of a narrowly tuned sucrose main band (Ss, left) and a narrowly tuned sucrose side band (NS, right) neuron before, during (horizontal black bars), and after oral infusion of sucrose at various concentrations (0.1–1.5 M). Notice that the typical LETO NS neuron respond at higher frequency to all sucrose concentrations compared with the OLETF NS neurons; only LETO Ss and NS neurons respond significantly to low concentration (0.1 M) sucrose, while OLETF neurons do not; the typical OLETF Ss neuron respond more vigorously to higher sucrose concentrations (1–1.5 M) compared with the typical LETO Ss neuron. This together with elevated threshold results in a rightward shift in the concentration code for sapid sucrose in the obese rats with augmented responses to the higher concentrations.

