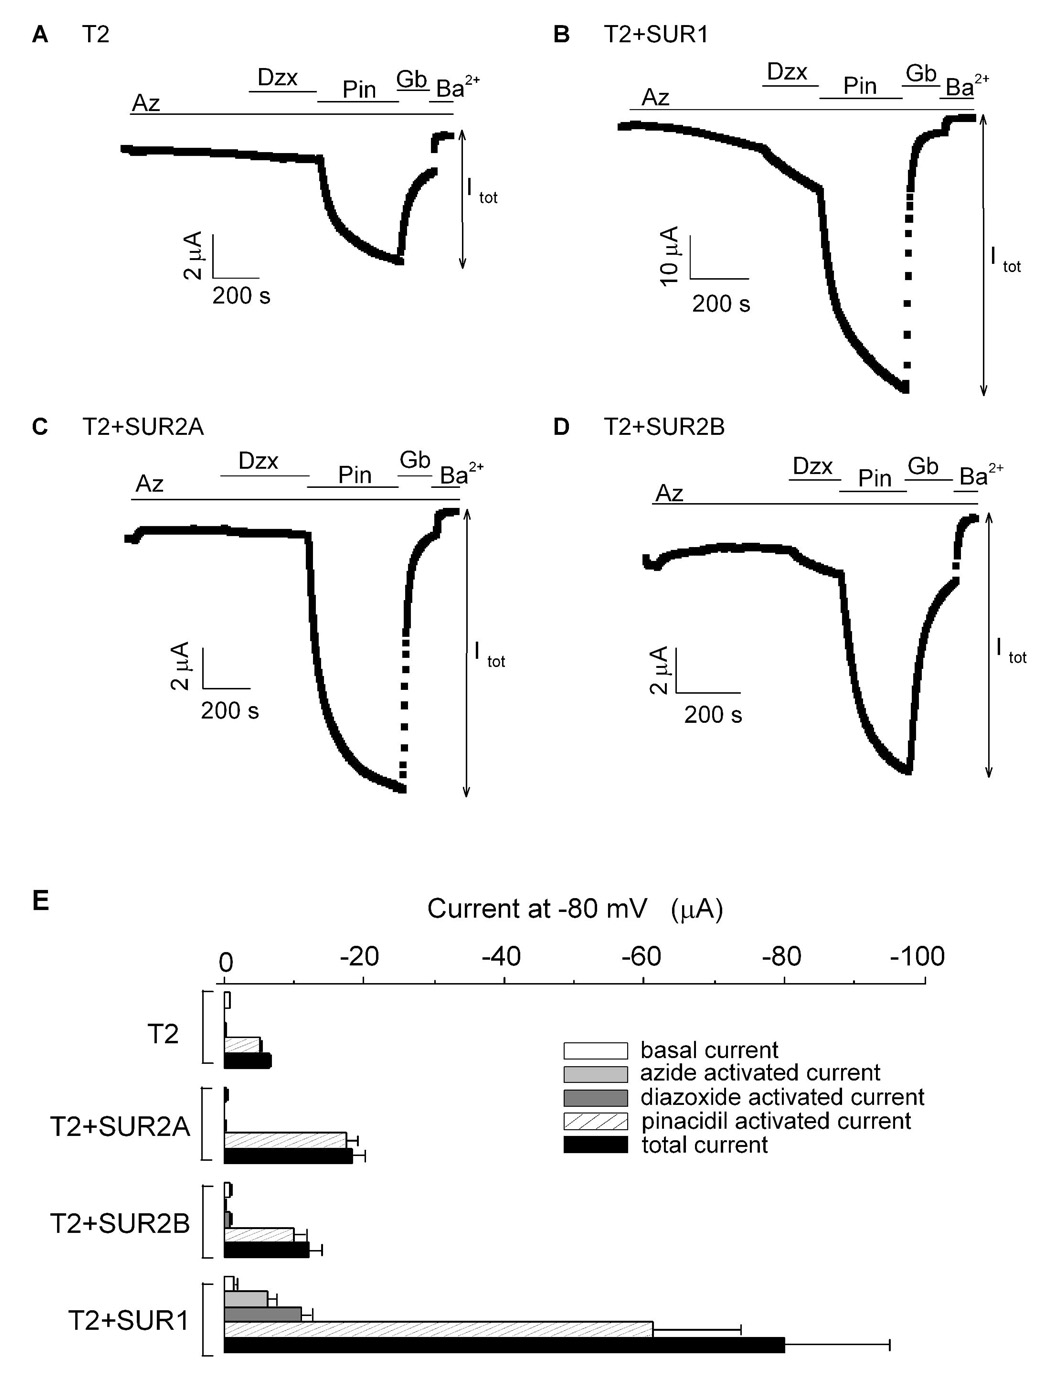
Fig. 6. Coexpression of T2 with different SUR subtypes indicates that SUR2A can associate with SUR1 and SUR2B.
A–D, time courses of the whole-cell currents recorded at −80 mV from oocytes expressing T2 alone (A), T2+SUR1 (B), T2+SUR2A (C) and T2+SUR2B (D). The colored bars indicate the presence of the various drugs/compounds in the 96K bath solution. The color coding is the same as in Figure 2. Itot for each channel is defined in the figure. E, bar-chart plots of the basal, activated and total currents obtained from oocytes expressing T2, T2+SUR1, T2+SUR2A and T2+SUR2B. The total current is the sum of the basal and all the activated currents (i.e. Itot= Iba + Iaz + Idzx + Ipin).

