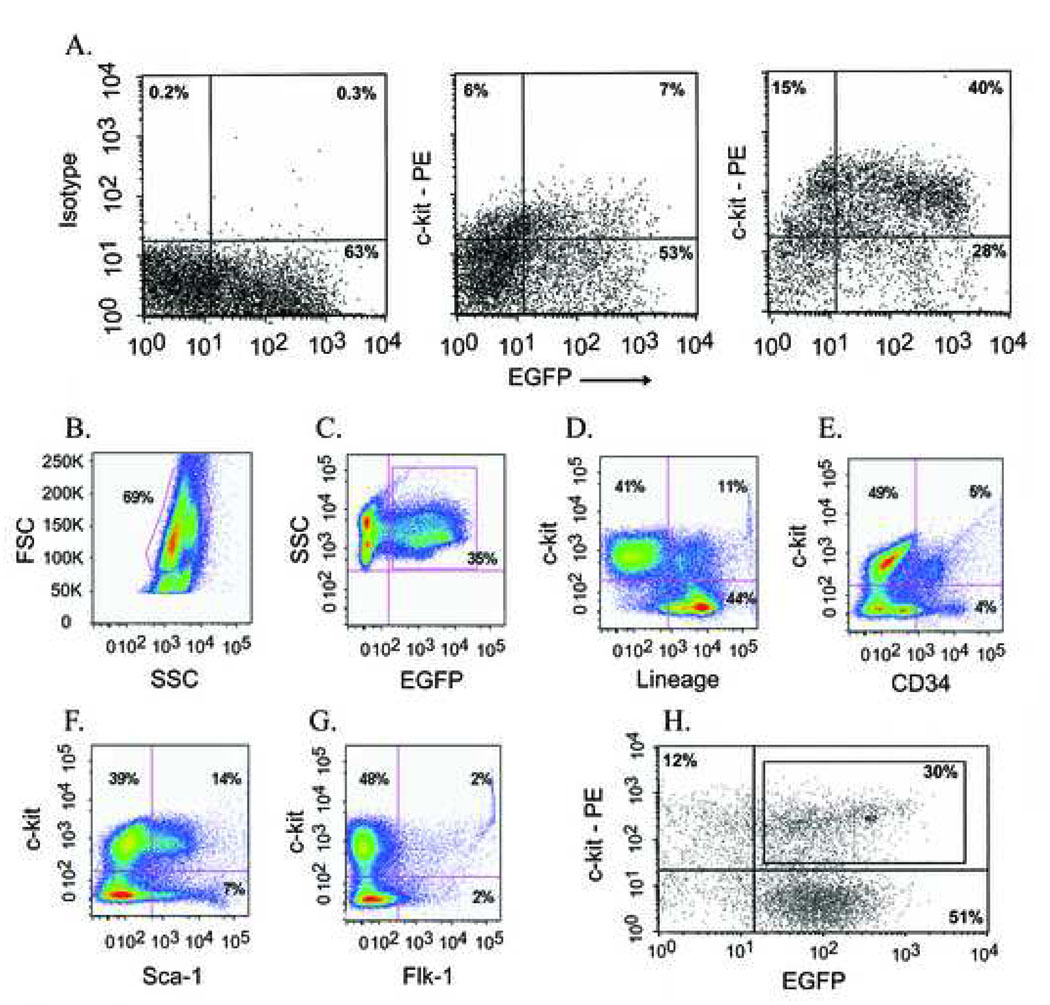
Figure 2.
Analysis of c-kitenr (panels A–G) and highly enriched lin− c-kit+ (panel H) BM cells. (A) Representative flow cytometry dot plots of the eluted (positively labeled; right panel) and eluent (unlabeled; middle panel) fraction of c-kitenr BM cells based on levels of EGFP (X axis) and c-kit (Y axis) expression. Left panel shows isotype control. Axes are log-scaled. (B – G) Flow cytometry analyses of surface antigen expression in ACT-EGFP c-kitenr BM cells. c-kitenr BM cells were selected for c-kit+ (CD117+) cells using MACS as described in Materials and Methods. (B) Light scatter gating of eluted cells identified approximately 70 % of the cells within the low density mononuclear gate (FSC, forward scatter). (C) Analysis of GFP expression versus side scatter (SSC) identified 35 % of eluted cells as GFP+. (D) Expression of lineage markers (X axis) versus c-kit expression (Y axis) among cells falling within the mononuclear gate as defined in panel B. (E) Expression of CD34 (X axis) versus c-kit expression (Y axis) among cells falling within the lymphocyte gate. (F) Expression of Sca-1 (X axis) versus c-kit expression (Y axis) among cells falling within the mononuclear gate. (G) Expression of Flk-1 (X axis) versus c-kit expression (Y axis) among cells falling within the mononuclear gate. (H) Fluorescence-activated cell sorting (FACS) of ACT-EGFP, lineage-depleted (lin−) mouse BM cells based on c-kit- and EGFP-expression. Representative FACS dot plot of lin− BM cells stained with ACK-4/Biotin/SA-PE. Antibody-labeled cells were separated by FACS into four subsets based on number of c-kit receptors (Y axis) and levels of EGFP (X axis) expression. Box in upper right rectangle indicates fraction of c-kit+/EGFP+ cells that was used for cell transplantation (lin− c-kit+ group). Mean expression levels of both c-kit and EGFP in c-kit+/EGFP+ cells were ~ 2-fold to ~ 100-fold higher than those in c-kit−/EGFP− cells (lower left rectangle).

