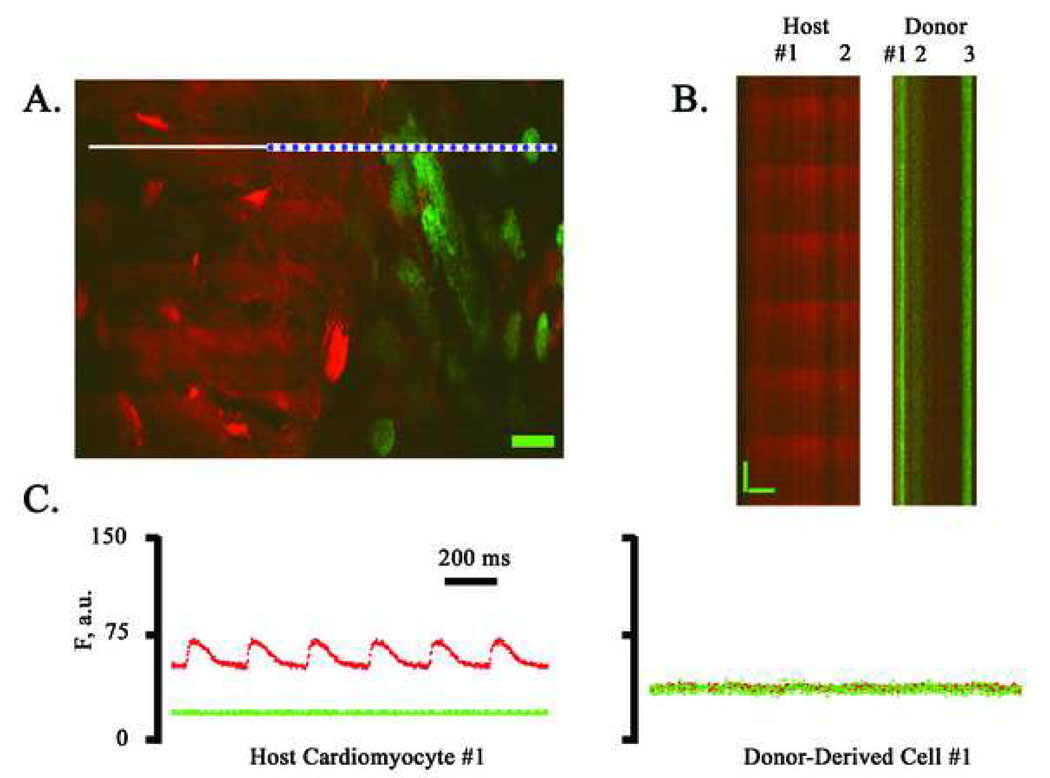
Figure 5.
Simultaneous imaging of rhod-2 and EGFP fluorescence in a non-transgenic heart at 9 days following coronary artery ligation and injection of ACT-EGFP c-kitenr BM cells into the peri-infarct zone. A, Full-frame TPLSM image of the graft/host myocardium border zone. Hearts were loaded with rhod-2. Host cardiomyocytes (red) and donor-derived cells (green/yellow) are apparent. The preparation was paced via point stimulation at a remote site at 4 Hz. The white bar demarks the position of line-scan mode data acquisition. Scale bar: 20 µm. (B) Stacked line-scan images of the regions in panel A demarked by the blue dotted lines. Line-scans traverse two non-EGFP-expressing, i.e. host, cardiomyocytes and three EGFP-expressing, i.e. donor-derived, cells. Scale bars: 20 µm horizontally, 125 ms vertically. (C) Spatially integrated changes in rhod-2 and EGFP fluorescence for one host cardiomyocyte and one juxtaposed donor-derived cell. The fluorescence signal across the entire cell was averaged. F, fluorescence; a.u., arbitrary units.

