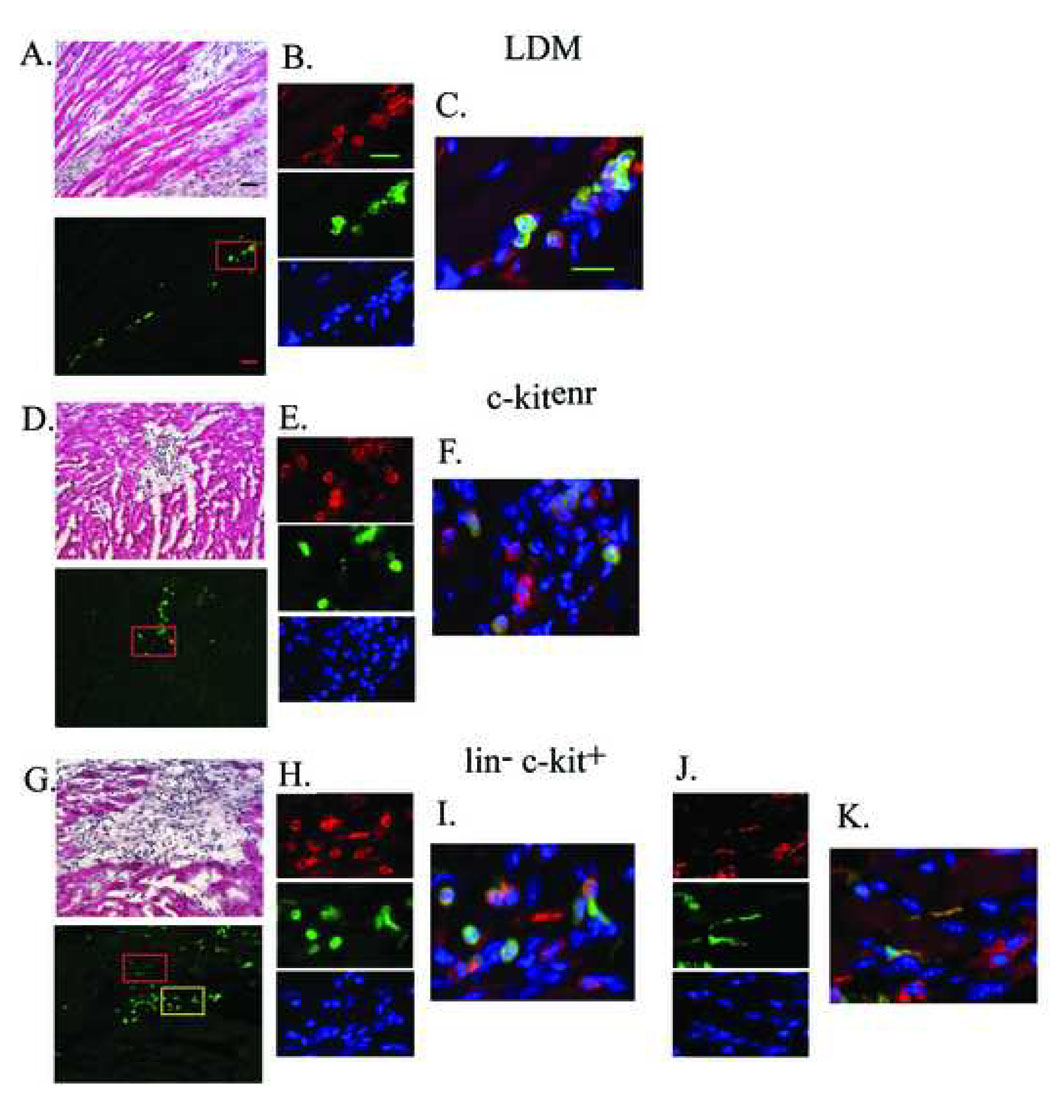
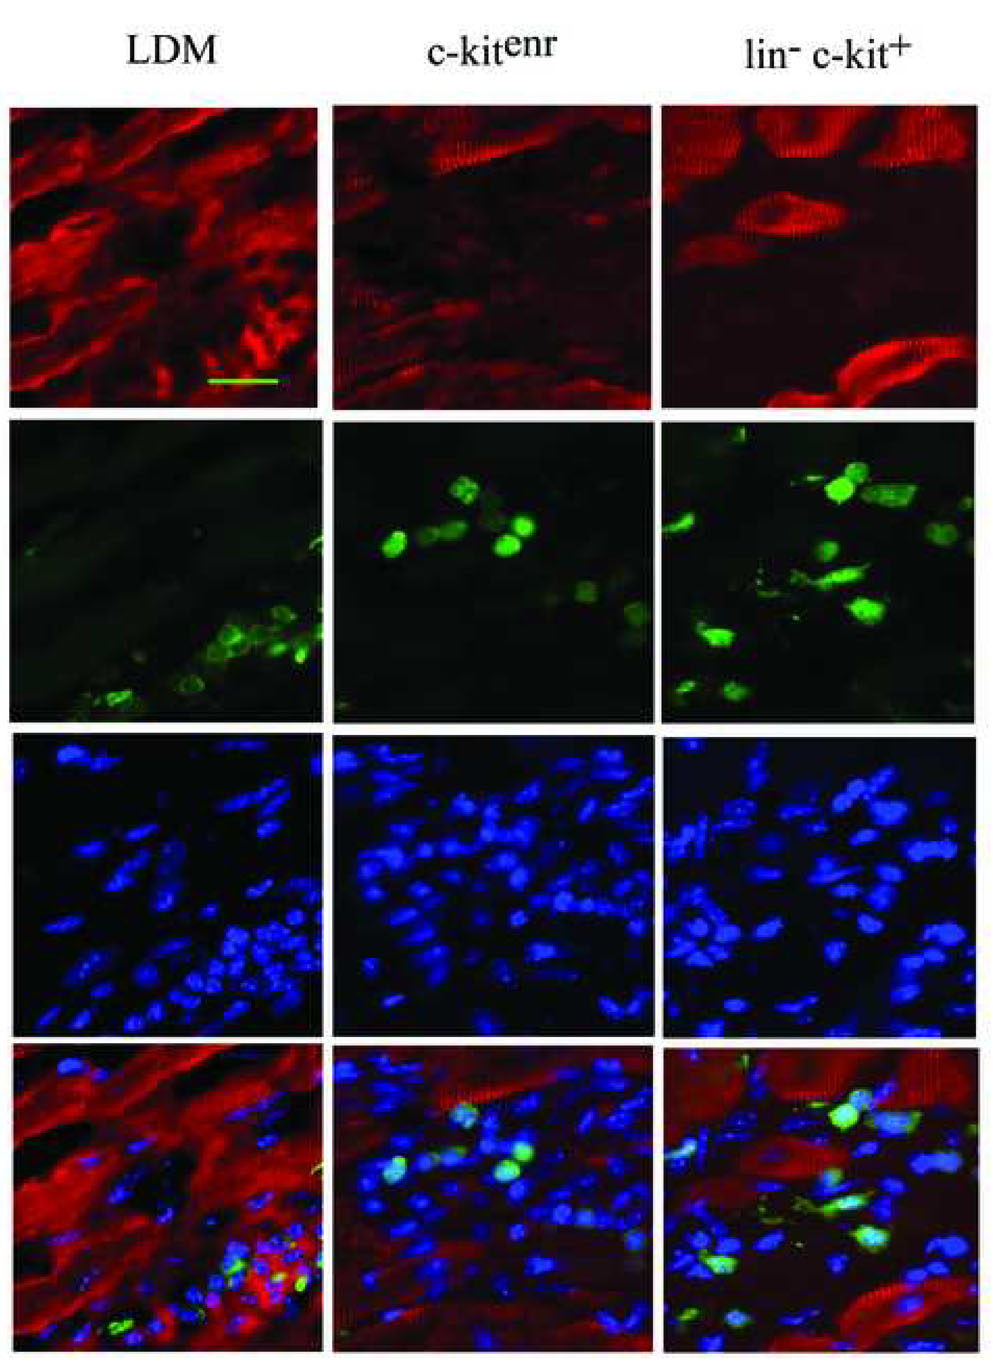
Figure 7.
Immune histological analyses for CD45, EGFP and α-actinin in 10-µm sections obtained from non-transgenic hearts at 9 days following coronary artery ligation and ACT-EGFP LDM (A–C), c-kitenr (D–F) or lin− c-kit+ (G–K) BM cells. The upper panels in A, D and G show representative Hematoxylin and Eosin (H&E)-stained sections of the transition zone between the surviving host myocardium and the infarct scar in the engrafted hearts. The lower panels show that the donor-derived cells (green) predominately engraft within scar tissue or at the infarct border zone, rather than within viable myocardium. The upper panels in B, E, H and J show representative images of CD45 expression, the middle panels show EGFP expression, and the lower panels show Hoechst nuclear staining; data is taken from the regions boxed in panels A, D and G (panels H and J correspond to the yellow and red box, respectively, in panel G). Panels C, F, I and K show the corresponding merged fluorescence images. Scale bar 30 µm in A; 20 µm in B and C. (L) α-actinin (red) expression, EGFP (green) expression and Hoechst nuclear staining in tissue sections adjacent to those shown in A, D and G. Scale bar, 20 µm.


