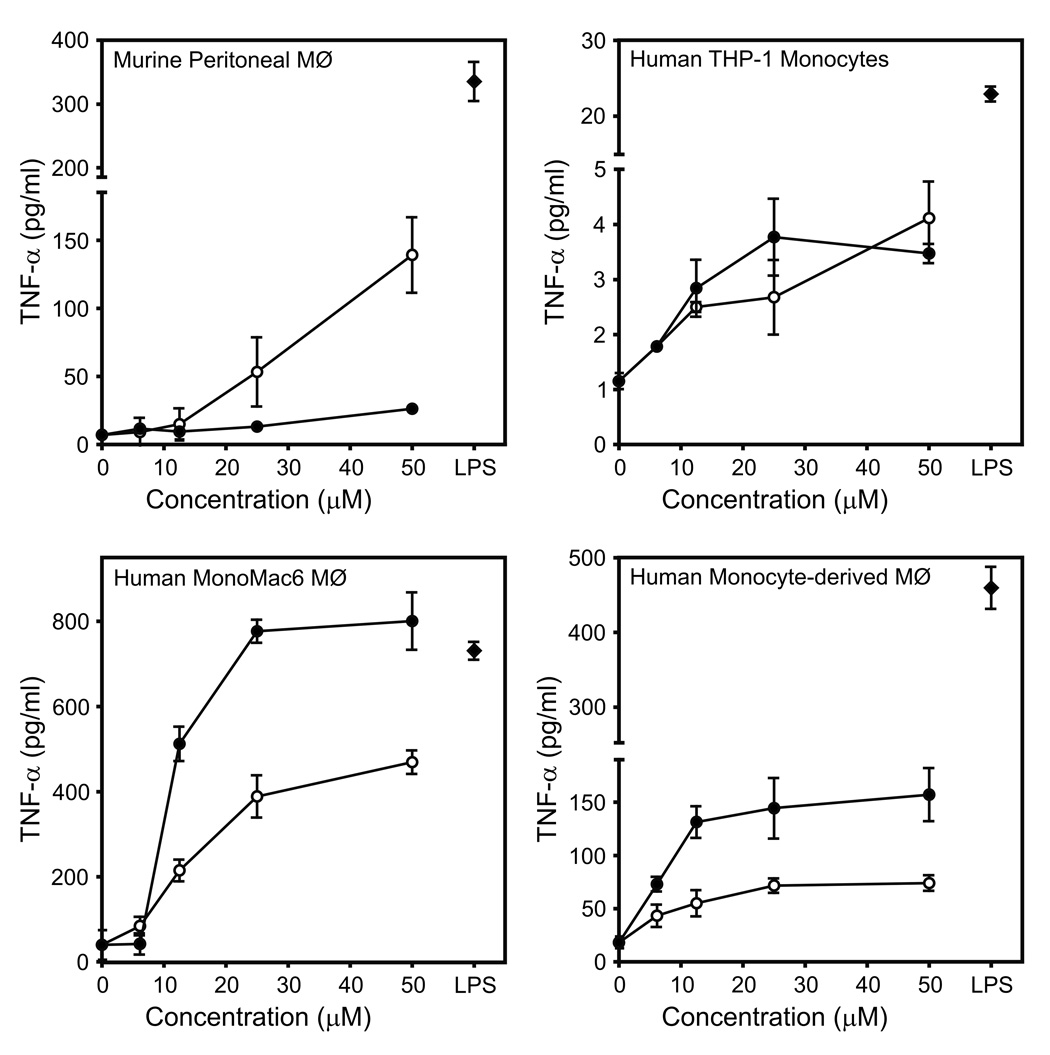
Figure 3.
Analysis of TNF-α production induced by Compounds 1 and 2 in murine peritoneal macrophages, human monocytic cells THP-1, human MonoMac6 macrophages, and human monocyte-derived macrophages. The indicated cells were incubated with buffer (0) or the indicated concentrations of Compound 1 (○), 2 (●), or LPS (50 ng/ml) (◆) for 24 hr, and TNF-α was measured in the cell supernatants by ELISA. The data are presented as the mean±SD of triplicate samples from one experiment, which is representative of three independent experiments.

