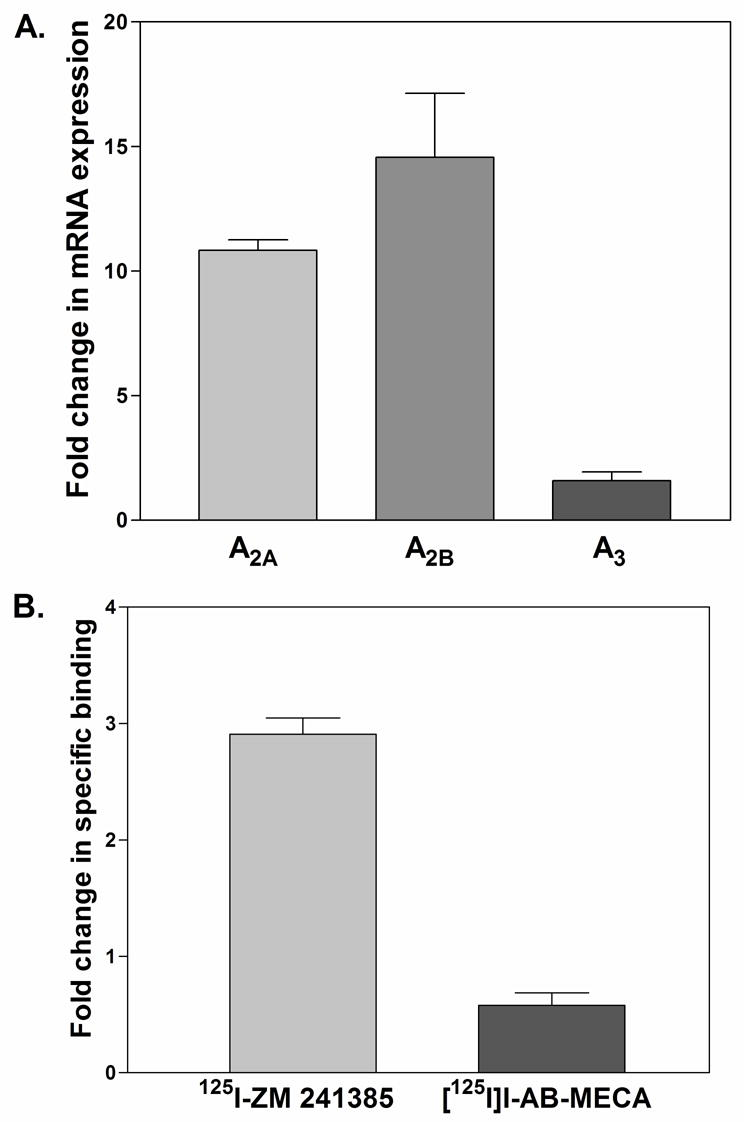
Figure 3.

Changes in AR mRNA (A) and protein (B) expression in bone marrow neutrophils from LPS-treated mice. Mice were injected ip with either vehicle or 10 mg/kg LPS. Four hours later, bone marrow neutrophils were obtained by Percoll gradient separation. AR mRNA levels were determined by real time RT-PCR normalized to 18S RNA. A2A and A3AR protein levels were determined by radioligand binding analysis with crude membrane preparations using 125I-ZM 241385 (~0.4 nM) or [125I]I-AB-MECA (~0.4 nM). Specific binding was defined by including 1 μM of the respective non-radiolabeled ligand in the assays. The data (mean ± SEM; n = 3) are presented as the fold increase in mRNA or protein expression in neutrophils from LPS-treated mice compared to vehicle-treated mice.
