
Fig. 3.
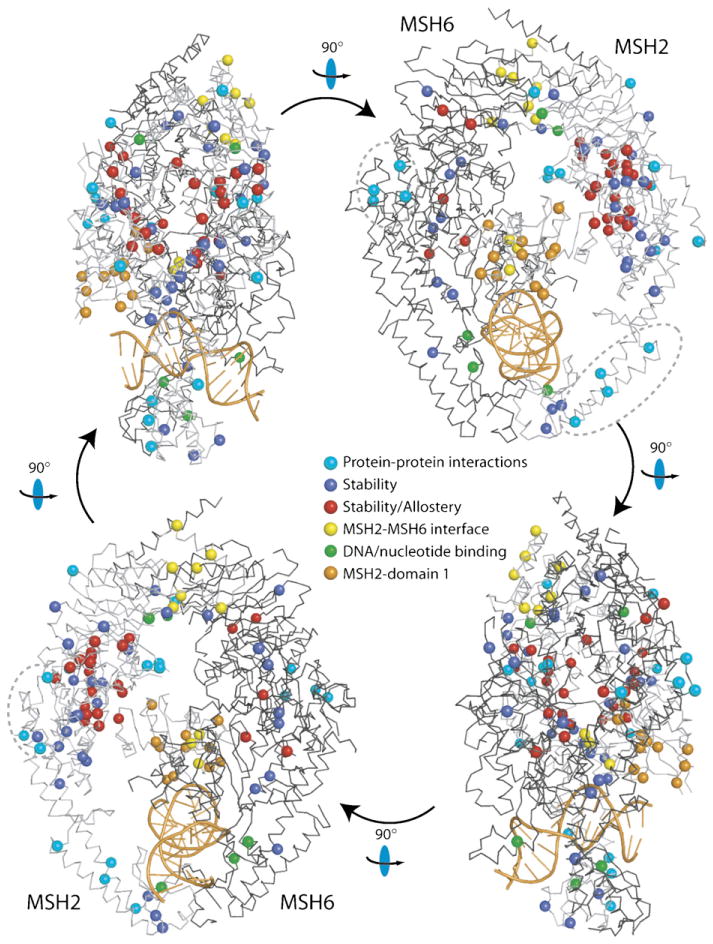
Structural model for human MutSα with HNPCC mutations. Four views of MutSα related by 90° rotations as indicated, with positions of HNPCC missense mutations indicated by spheres. Hypothetical functional classification of mutations is indicated by sphere colour (see legend). MSH2 and MSH6 are shown as light and dark grey Cα chain traces, respectively, and the DNA is coloured orange. Three clusters of surface mutations, which may correspond to sites of protein-protein interactions are indicated with dashed ovals. Reproduced with permission (Warren et al., 2007).