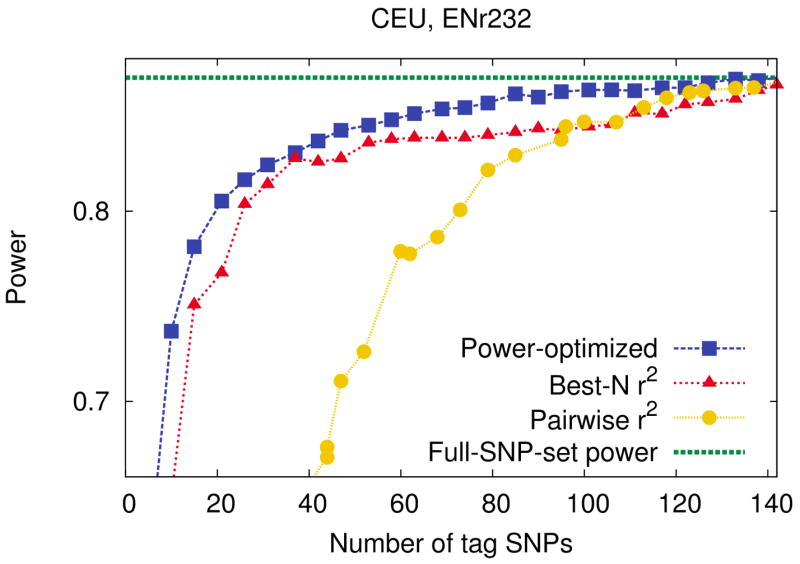
Figure 1.

Power comparison between our power-optimized tag SNP selection method and a widely used r2-based methods, pairwise r2 tagging and best-N r2, in the ENr232 ENCODE region of the CEU population. We use a 5% region-wide significance level, a 5% MAF threshold for causal SNPs, and assume relative risk of 1.2, disease prevalence of 0.01, and 4,000 cases and 4,000 controls. We use the r2 threshold of 0.8 for best-N r2. The x-axis ranges up to the number of tags obtained by best-N r2 to cover every SNP with r2 = 0.8. The purple horizontal dashed line indicates the full-SNP-set power achievable by genotyping the full set of SNPs.
