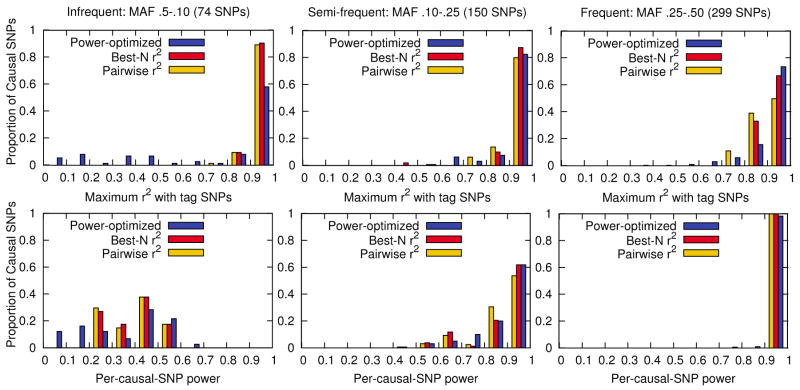
Figure 2.
Maximum r2 and per-causal-SNP power distribution over all 533 causal SNPs in the ENr232 ENCODE region of the CEU population. We divide the causal SNPs into three groups by their MAF: infrequent (5%–10%), semi-frequent (10%–25%), frequent (25%– 50%), which contains 74, 150, 299 SNPs respectively. Each bar of different colors represent the power-optimized tagging method (85 tag SNPs), pairwise r2 tagging method (123 tag SNPs), and best-N r2 tagging method (138 tag SNPs). The three tag sets achieves the same 99% of full-SNP-set power.

