
Figure 3.
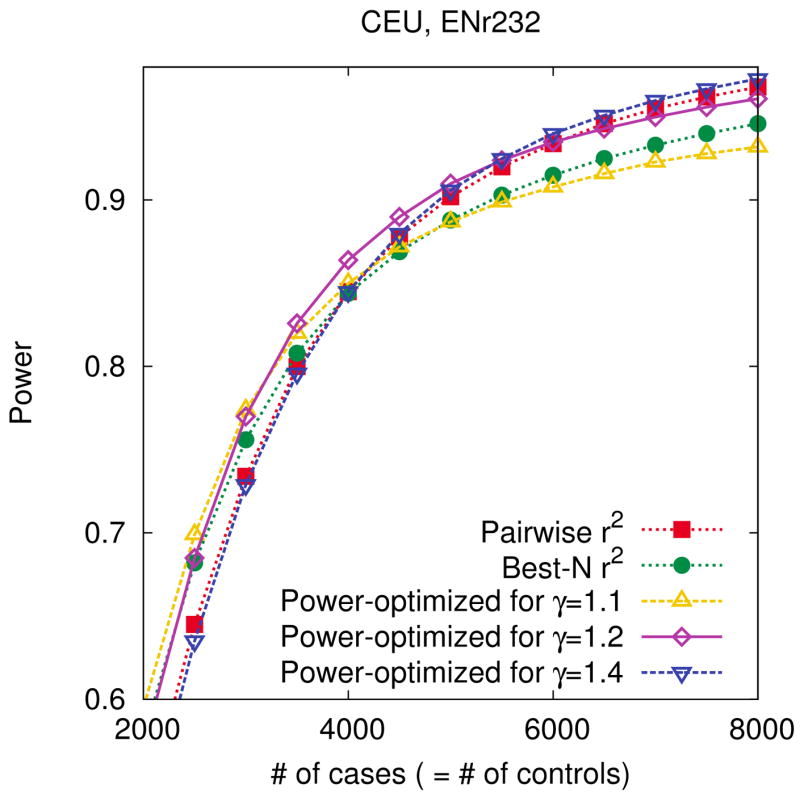
Robustness of our power-optimized method to errors of parameter selection. We use our power-optimized method to design three different tag sets of size 100 assuming different relative risks of 1.1, 1.2, 1.4 in the ENr232 ENCODE region of the CEU population. We also design two more tag sets of the same size using pairwise r2 tagging and best-N r2. We then measure the power of each tag set based on the assumption of a true relative risk of 1.2. We use a 5% region-wide significance level, a 5% MAF threshold for causal SNPs, and assume a disease prevalence of 0.01 and 4,000 cases and 4,000 controls when designing the tag sets.