
Figure 7.
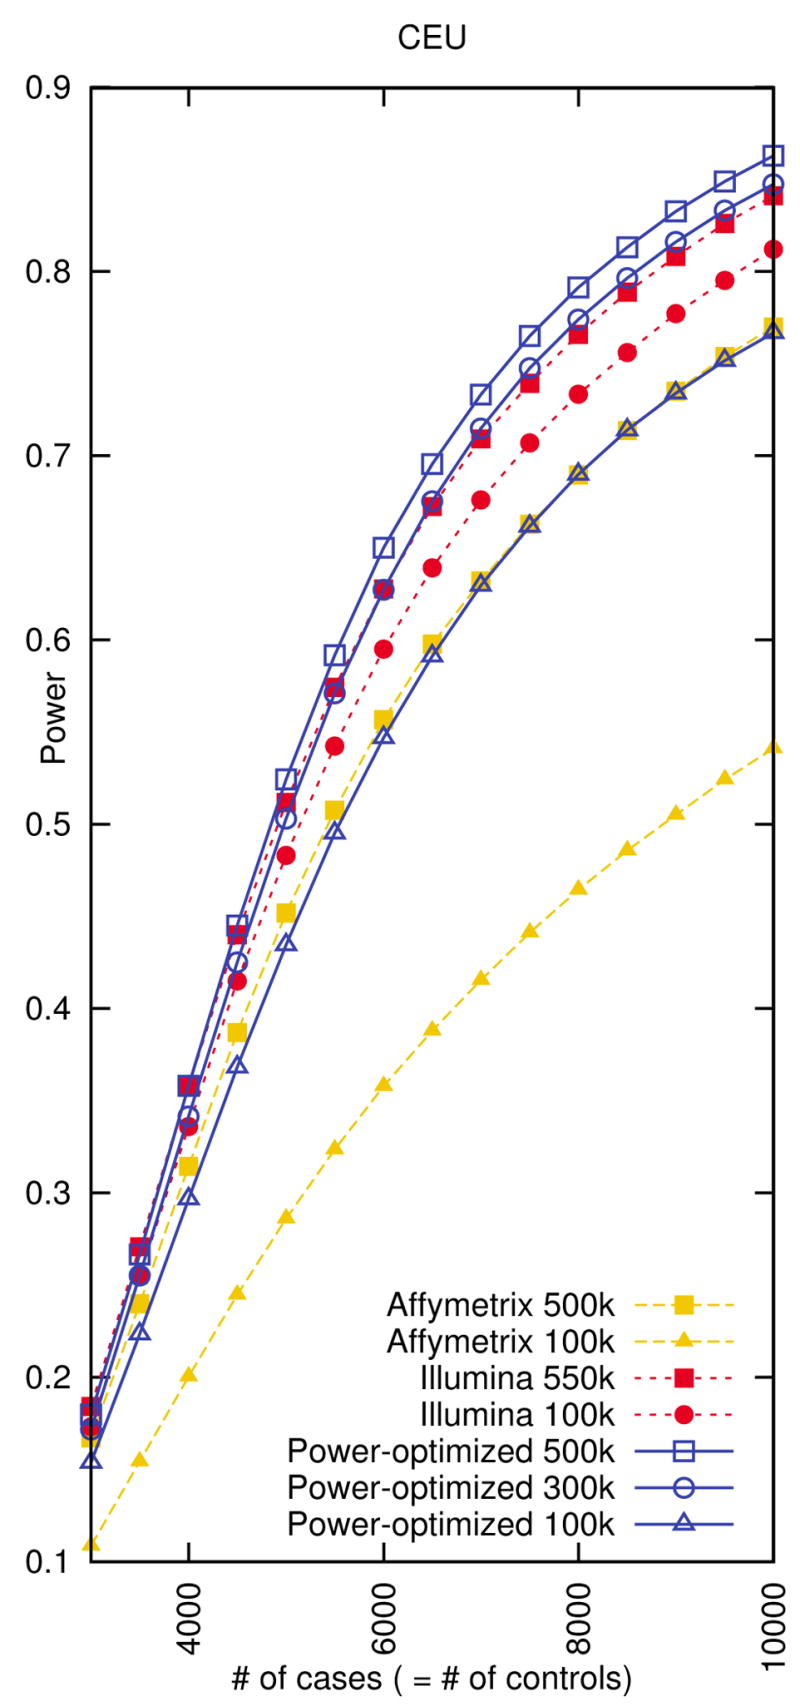
Genome-wide power comparison between whole genome tag sets designed by our power-optimized method and the commercial products in the CEU population. We measure the power assuming relative risk of 1.2, disease prevalence of 0.01, a 5% genome-wide significance level, and a 5% MAF threshold for causal SNPs. We use 8,000 cases and 8,000 controls when designing the tag sets.