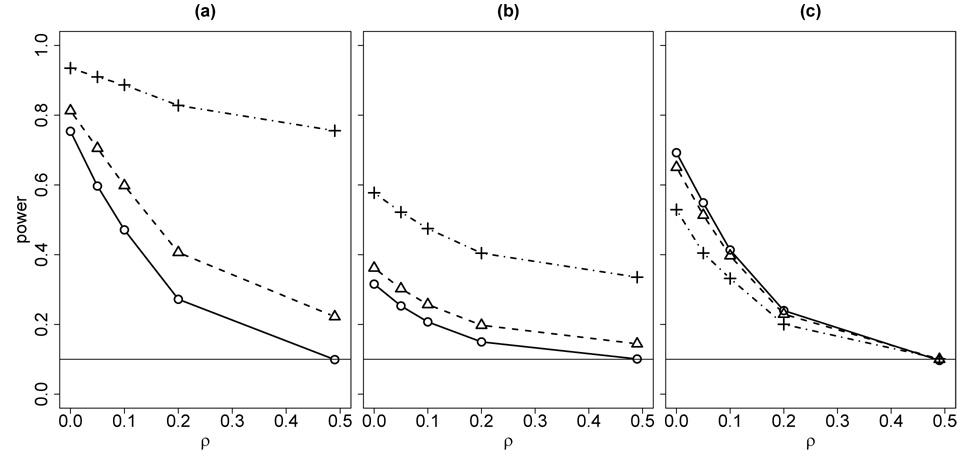
Figure 3.
Power to detect linkage under marker model misspecification for the resimulation-based test (a), fuzzy p-value approach (b) and permutation test (c). The solid line in each graph shows the power to detect linkage at recombination fractions 0,.05, .1,.2,.5 between the marker locus and the trait locus under the correct marker allele frequencies (.4, .3, .2, .1). The dashed line in each graph shows the power at different recombination fractions when the marker allele frequencies were misspecified as (.25,.25,.25,.25). The dotted line shows the power at different recombination fractions when the marker allele frequencies were misspecified as (.1, .2, .3, .4).

