Fig. 1.
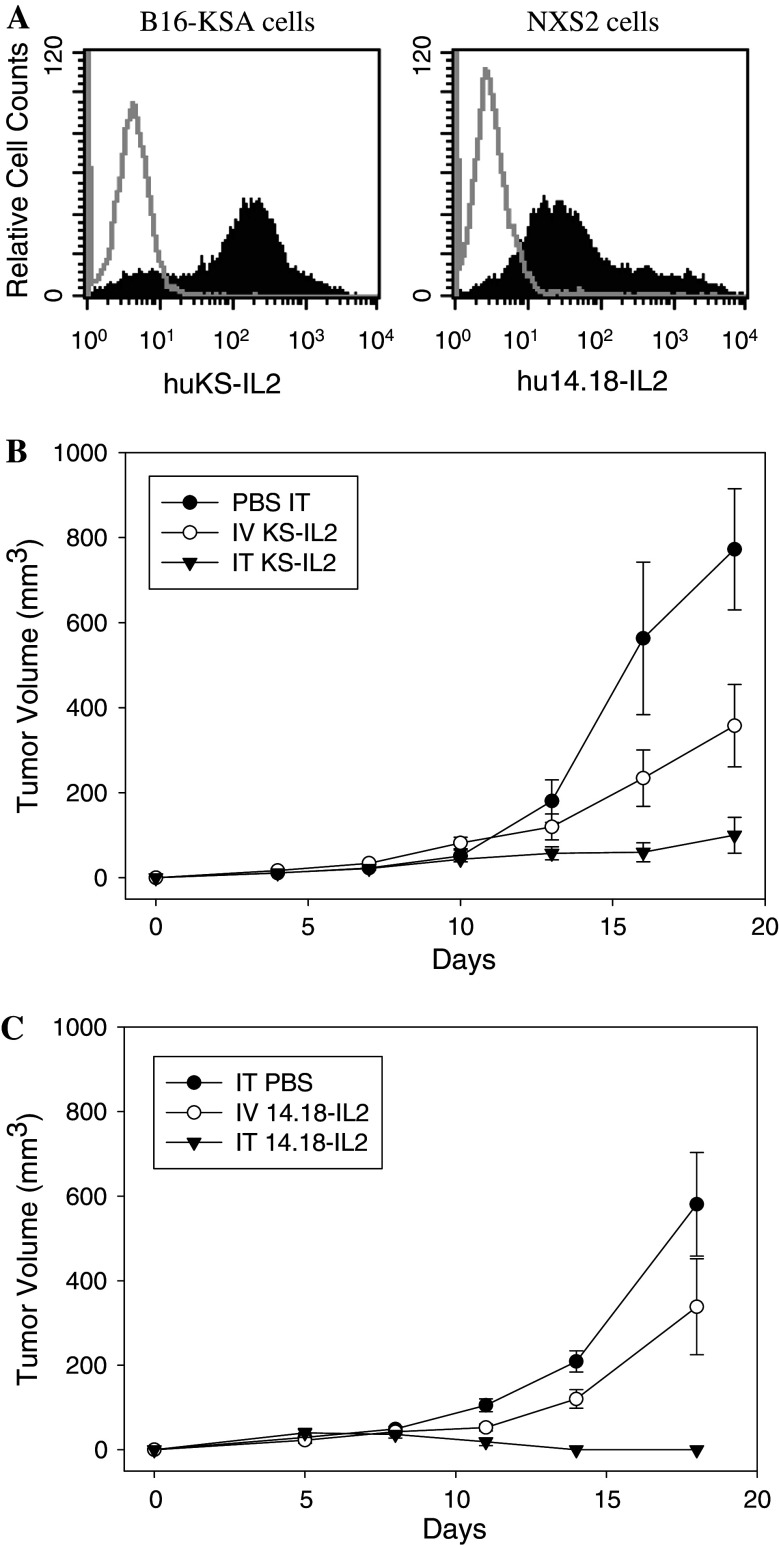
Tumor-associated antigens expression and enhanced antitumor effect of IT ICs compared to IV IC administration. a Flow cytometric expression of tumor-associated antigens, EpCAM on B16-KSA cells (left panel) and GD2 on NXS2 cells (right panel), is shown by binding of huKS-IL2 (filled histogram, left panel) and hu14.18-IL2 (filled histogram, right panel). Gray lines represent control staining with anti-human IL2-PE alone. The y-axis shows the relative cell counts and the x-axis shows the fluorescence intensity units. b Groups of C57BL/6 mice (eight per group) were implanted with 3 × 10⁵ B16-KSA tumor cells on day 0 and treated with 15 μg IV huKS-IL2 (in 200 μl) or IT IC (in 50 μl) on days 7–11. Control mice were treated with IT PBS (50 μl). (p = 0.02 day 16, p = 0.03 day 19 for IT IC vs. IV IC; p = 0.01 day 16, p < 0.001 day 19 for IT IC vs. IT PBS) Results are representative of 2 similar experiments. c Groups of A/J mice (five per group) were implanted with 2 × 10⁶ NXS2 cells (day 0) and treated with IT PBS, 15 μg IV hu14.18-IL2 (in 200 μl) or IT IC (in 50 μl) on days 7–11. (p < 0.0015 for IT hu14.18-IL2 vs. IT PBS, days 11–18; p < 0.02 for IT hu14.18-IL2 vs. IV hu14.18-IL2 days 11–18.) Results are representative of three similar experiments

