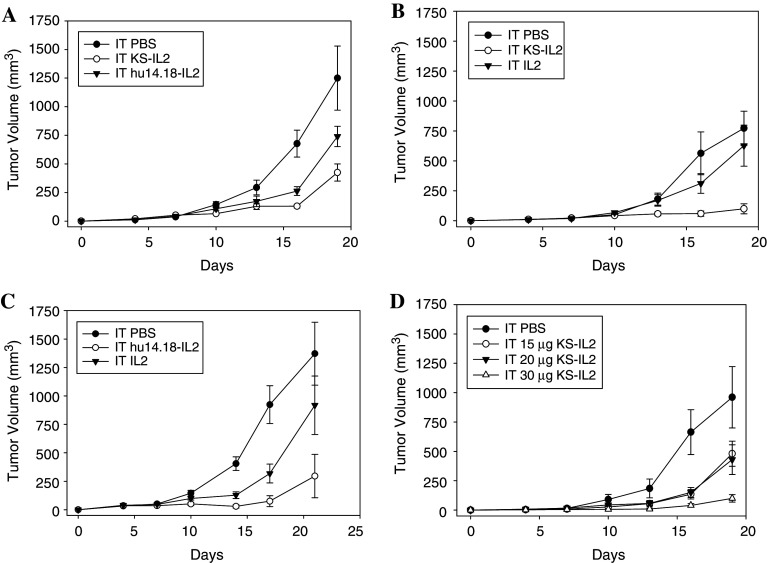
Fig. 3.
Specificity and dose response of IT IC. a C57BL/6 mice (eight per group) were implanted with 3 × 10⁵ B16-KSA tumor cells on the abdomen on day 0. Mice were treated with 15 μg IT huKS-IL2, hu14.18-IL2, or PBS (in 50 μl) on days 7–11. Data are representative of two experiments. (p = 0.02 day 16 for huKS-IL2 vs. hu14.18-IL2, p = 0.06 day 19 for huKS-IL2 vs. hu14.18-IL2; p = 0.003 day 16 hu14.18-IL2 vs. PBS, p = 0.04 day 19 hu14.18-IL2 vs. PBS). b C57BL/6 mice (eight per group) were implanted with 3 × 10⁵ B16-KSA cells on day 0. Mice were treated with 15 μg IT huKS-IL2, 45,000 IU IL2, or PBS (in 50 μl) on days 7–11. (p = 0.01 for IT PBS vs. IT huKS-IL2, p = 0.002 for IT huKS-IL2 vs. IT IL2, p = NS for IT PBS vs. IT IL2 days 16–19) Data are representative of two experiments. c Groups of A/J mice (5–6 per group) were implanted with 2 × 10⁶ NXS2 cells on day 0. Mice were treated with 15 μg IT hu14.18-IL2, 45,000 IU IL2, or PBS (in 50 μl) on days 7–11. (p < 0.001 for IT PBS vs. IT hu14.18-IL2 days 10–17, p < 0.01 for IT PBS vs. IT IL2 days 14–17, p = 0.03 for IT hu14.18-IL2 vs. IT IL2 days 10–17). d C57BL/6 mice (six per group) were implanted with 3 × 10⁵ B16-KSA cells on day 0. Mice were treated IT with 15, 20, or 30 μg of huKS-IL2 (in 50 μl) on days 7–11. Control mice received 50 μl IT PBS on days 7–11. (p = 0.05 for 15 ug huKS-IL2 and 20 μg huKS-IL2 vs. 30 μg huKS-IL2 day 16)

