
Fig. 4.
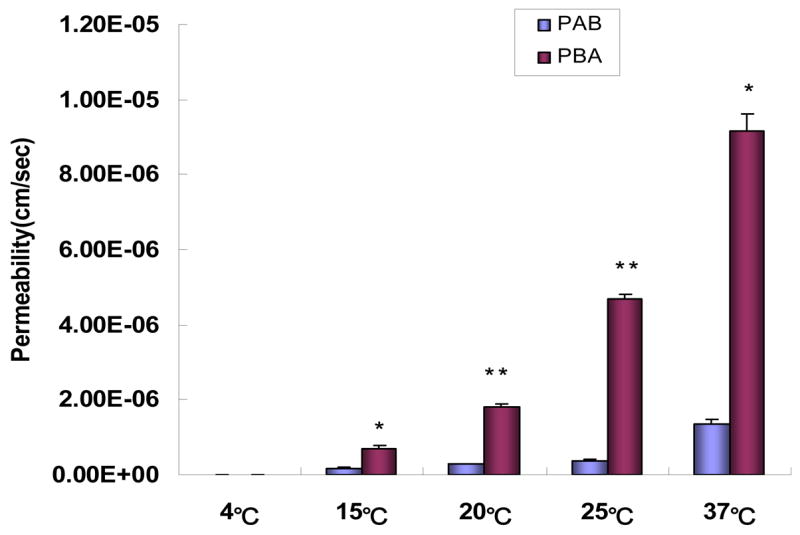
Permeabilities of baohuoside I (20μM) at different temperatures. The experiments were performed at 37°C. Permeabilities plotted here are similarly generated as described in Fig. 3. Each bar represents the average of three determinations and the error bars are the standard deviation of the means. The “*” symbol indicates that absorptive permeability (PAB) and secretory permeabilities (PBA) values at this concentration are significantly different from each other (p<0.01). One-way ANOVA with Tamhane’s post hoc was used to analyze the data statistically.