
Fig. 7.
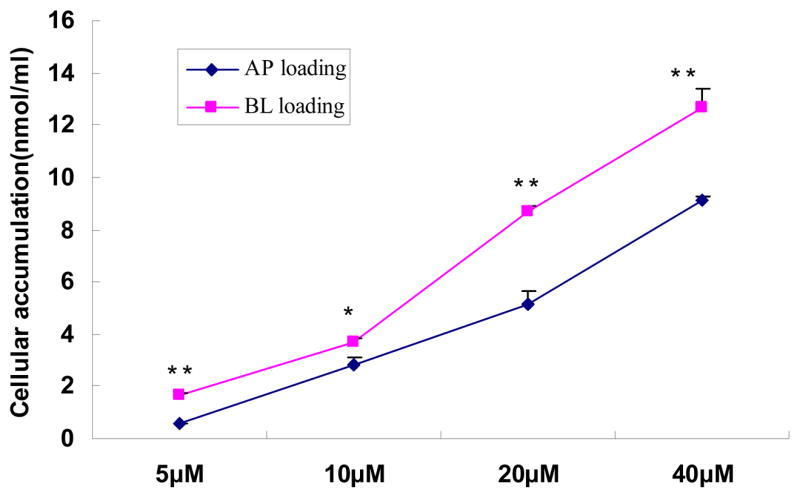
Effect of concentration on the cellular accumulation of baohuoside I at 37°C. The accumulation was measured after 5 hr incubation of cell monolayers with baohuoside I. Each data point is the average of three determinations, and the error bars represent the standard deviation of the mean. The “*” symbol indicated statistically significant difference between loading side. One-way ANOVA with Tamhane’s post hoc was used to analyze the data statistically.