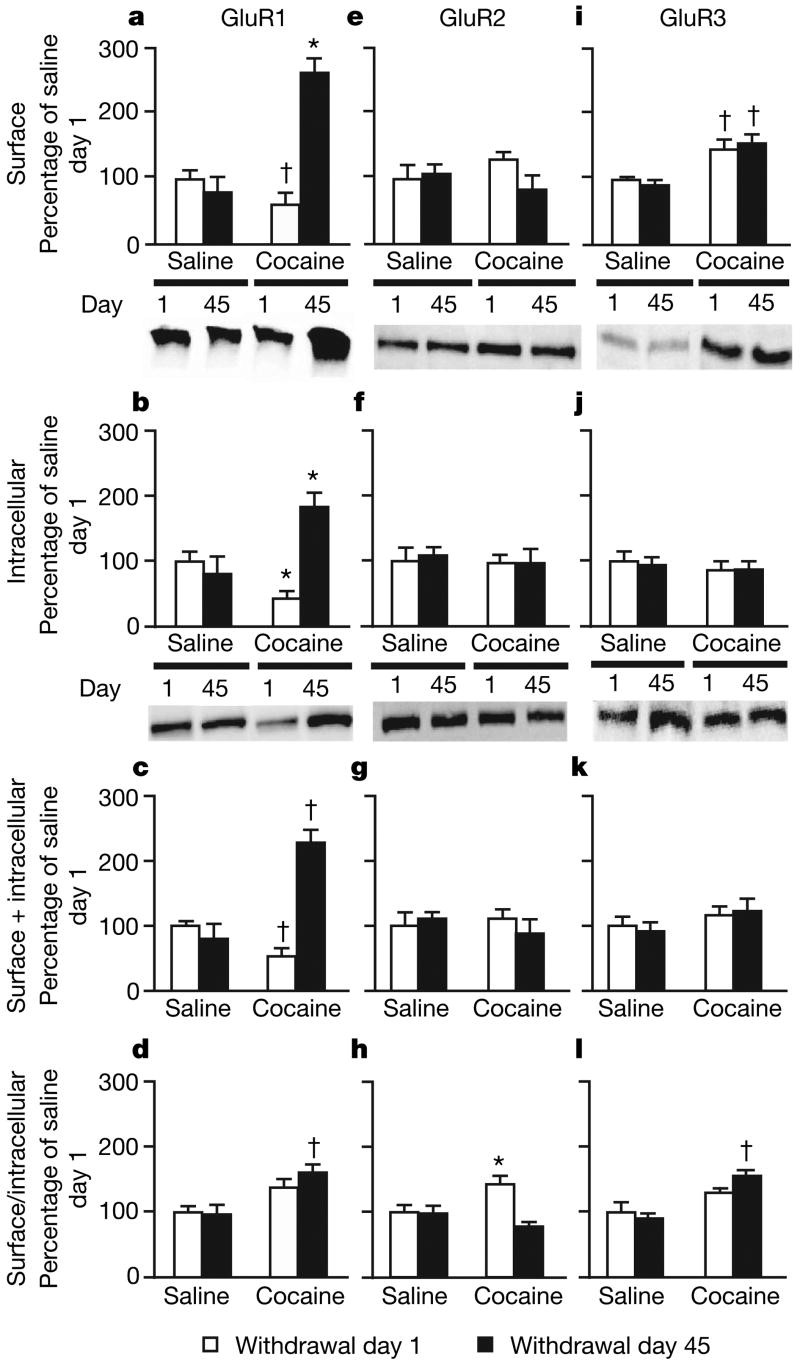
Figure 2. Accumbens GluR1 and GluR3 expression increase after withdrawal from cocaine self-administration.
a–d, GluR1 increased markedly in cocaine-exposed rats on withdrawal day 45 (surface (a), intracellular (b) and total (c) GluR1; drug exposure × day interaction, F1,56 = 9.9, F1,56 = 9.2 and F1,56 = 12.1, respectively; P < 0.01). d, Surface/intracellular ratio. e–h, GluR2 was unchanged except for a small increase in the surface/intracellular ratio in cocaine-exposed rats on withdrawal day 1 (drug exposure × day interaction, F1,53 = 4.0; P < 0.01). i–l, Surface GluR3 and the surface/intracellular ratio increased after self-administration of cocaine (drug exposure, F1,48 = 4.4 and F1,48 = 3.9, respectively; P < 0.05). Data (means and s.e.m., n = 12–18 per group) are expressed as percentages of the values in the saline group on withdrawal day 1. Asterisk, significantly different (P < 0.05) from other conditions; dagger, significantly different (P < 0.05) from saline group on withdrawal day 1.

