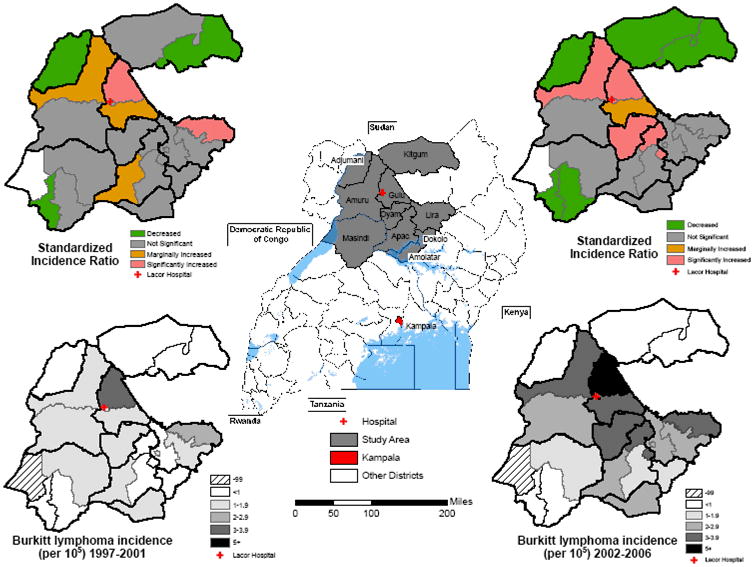
Figure 1.

Map showing location of study area in northern Uganda and the names and district boundaries (centre map). Study maps show, on the lower panels the crude BL incidence and, on the upper panels, the standardized incidence ratio, by county for the periods 1997-2001(left) and 2002-2006 (right). Bold lines indicate district boundaries, thin lines indicate county boundaries. Hatch marked area indicates counties without any case counts.
