
Figure 2.
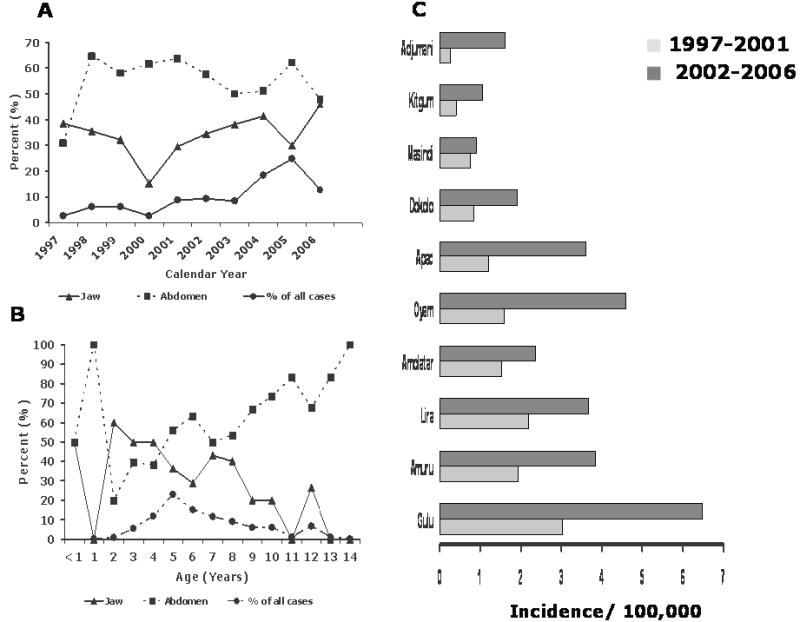
A: Line graph showing the percent of cases presenting as abdominal (with or without jaw) or only jaw tumors by calendar year and percent of cases by calendar year (1997-2006)
B: Line graph showing the percent of children with only jaw, abdominal (with or without jaw) and the percent of cases BL by age (0 through 14 years).
C: Bar graphs showing age-standardized (to the world population) incidence rates for BL for 10 districts in northern Uganda for calendar-year periods 1997-2001 and 2002-2006.