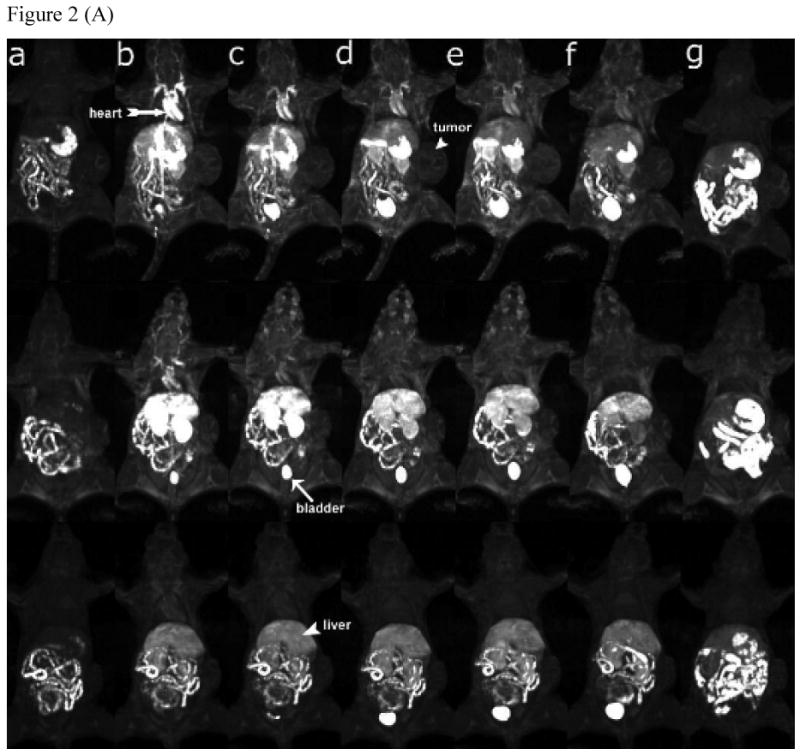
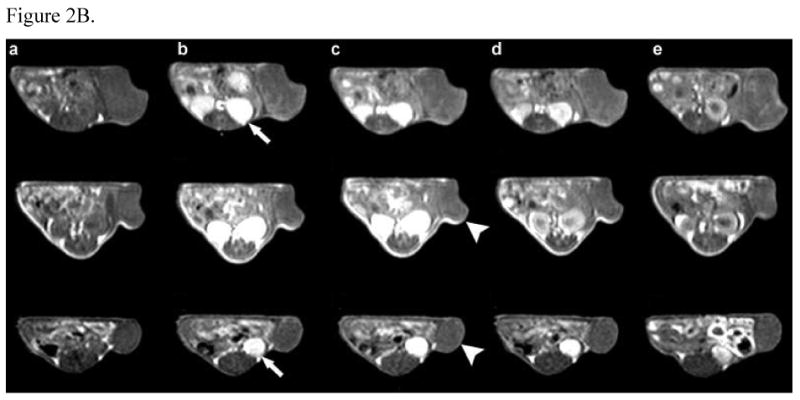
Figure 2.


(A) 3D MIP images (coronal view) of mice receiving 0.05 mmol-Gd/kg PEG-PGA-(Gd-DO3A)-Mce6 (top panel), PGA-(Gd-DO3A)-Mce6 (middle panel), and PGA-(Gd-DO3A) (bottom panel) before (a) and at 2min (b), 5 min (c), 15 min (d), 30 min (e), 2 hours (f) and 18 hours (g) post injection. (B) 2D spin-echo axial images of tumor in mice receiving 0.05 mmol-Gd/kg PEG-PGA-(Gd-DO3A)-Mce6 (top panel), PGA-(Gd-DO3A)-Mce6 (middle panel), and PGA-(Gd-DO3A) (bottom panel) before (a) and at 2min (b), 30 min (c), 2 hours (d) and 18 hours (e) post injection. Arrow points to kidneys and arrowhead points to tumor.
