
Figure. 6.

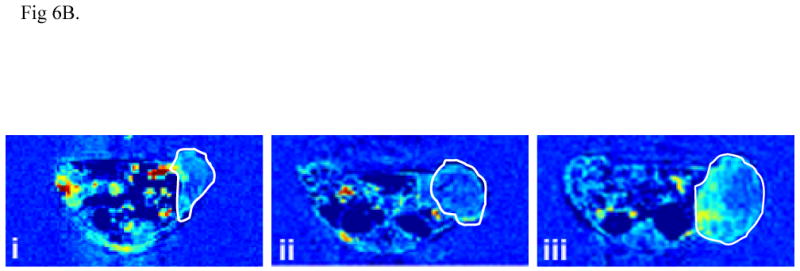
Relative signal intensity plots of the DCE-MRI data showing the dynamic uptake of (Gd-DTPA)-cystine copolymers in tumor periphery (A) and representative vascular flow leakage rate map (B) of tumor bearing mice after PDT with PEG-PGA-(Gd-DO3A)-Mce6 (i), PGA-(Gd-DO3A)-Mce6 (ii) and PGA-(Gd-DO3A) (iii). Tumor area is shown in the cycle.