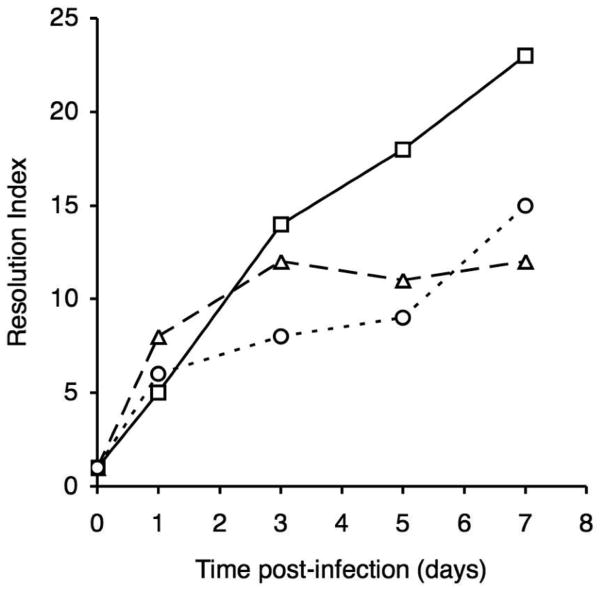
Fig. 3.
Resolution index values for RIVET strains at various times post-infection. Values represent the fold-change in mean resolution frequency compared with the base-line resolution frequency determined for the input inocula. Strains: TohI-res-R-alcA (squares), TohI-res-R-bfeA (triangles), and TohI-res-R-bhuR (circles).

