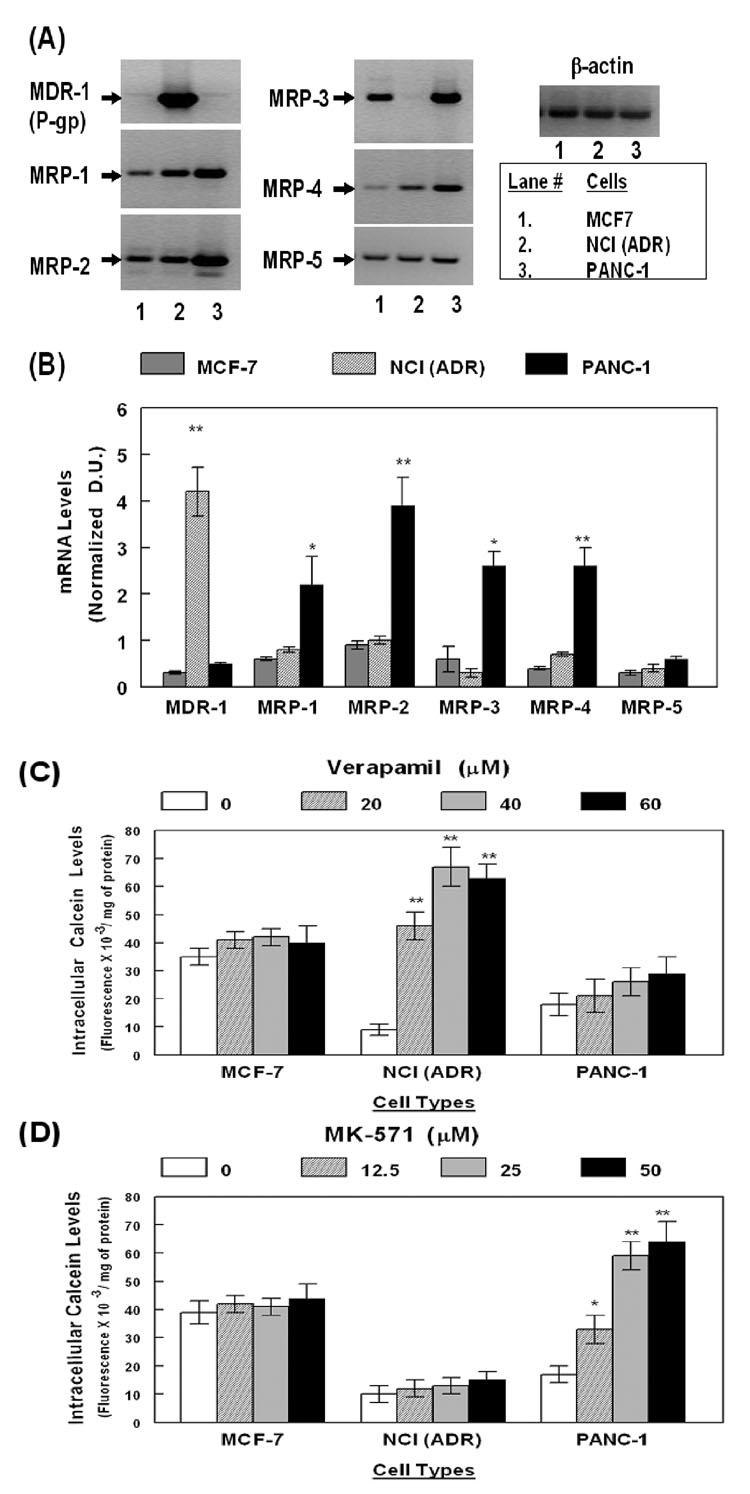
Figure 1. ABC-transporter gene expression and transporter specific efflux function in MDR-1 and MRP overexpressing cell lines.
The MCF7, NCI(ADR) and PANC-1 cells were used as controls for MDR-1 (P-gp) and MRP (MRP-1, to MRP-5) gene expression and MDR-1 and MRP mediated efflux function. In (A), the RT-PCR amplified products are shown in a representative gel picture. The densitometric values of product intensities (n=4) were normalized to β-actin levels. In (B), the ratios are presented as empirical densitometric units (D.U.). Drug-efflux data from calcein assays are shown in (C) and (D). Fluorescence readings (Fluorescence/mg of protein) observed in the absence (clear bars) or presence of either verapamil (C) or MK-571 (D) are shown (n=5). Error bars represent the ±SEM of values and significant differences in mRNA expression and calcein-retention, are indicated by P values (*, p<0/05; **, p<0.02).

