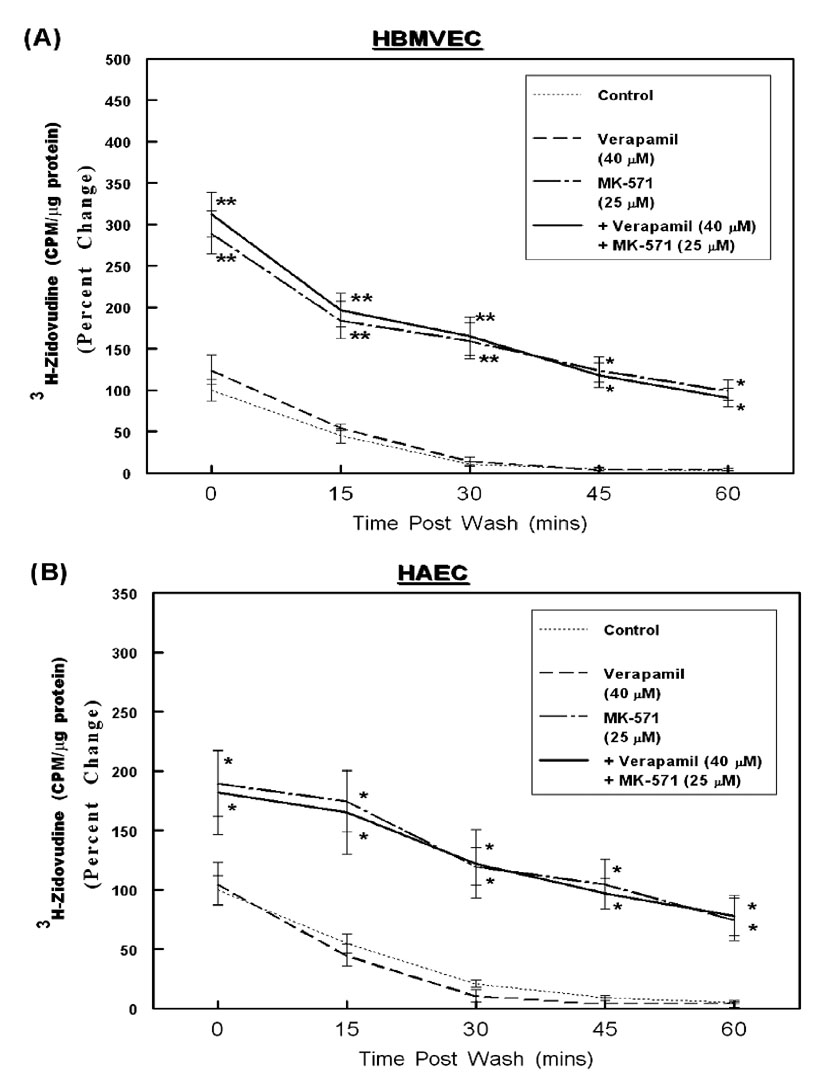
Figure 5. MDR-1 and MRP-mediated efflux of Zidovudine from HBMVECs and HAECs.
Intracellular accumulation and temporal efflux of 3H-zidovudine was measured in both HBMVECs (A) and HPAECs (B), similar to the saquinavir efflux studies. The percent changes in normalized values (CPM/ µg of protein) are depicted in the line graphs (n=3). Error bars represent ±SEM and significant differences in zidovudine accumulation and temporal efflux are indicated by P values (* p< 0.05; ** p< 0.01).

