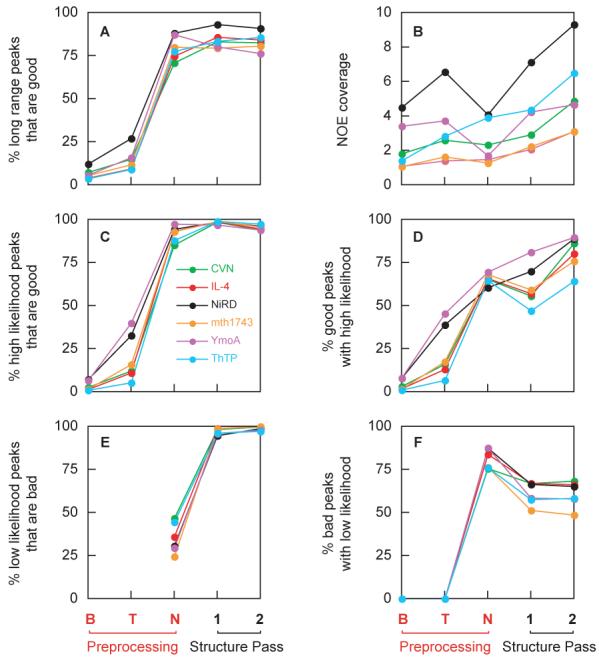
Fig. 4.

NOE statistics at various points during the progress of the PASD protocol. The x-axis represents different stages of the structure determination, with B and T corresponding to initial broad-tolerance matching and tight tolerance matching, respectively. For the first two stages, all matched peak assignments are assumed 100% likely. N corresponds to results after the network analysis stage where likelihoods are assigned via the network contact map. 1 and 2 correspond to results after the first and second structure passes, respectively. Plotted are (A) the percent long range peaks (no assignments within 5 residues in primary sequence) that are good (have violations of < 0.5 Å) as measured by the appropriate reference structure; (B) is the NOE coverage, or number of high-likelihood (> 90% likely), long-range peak assignments per residue; (C) the percent of high likelihood peaks that are good according to the reference structure; (D) the percent good peaks which have high likelihood; (E) the percent low likelihood peaks that are bad (for stages B and T all peaks are assumed to be high-likelihood such that this measure is not defined); and (F) the percentage of bad peaks with low likelihood. A peak is considered to be bad if it has an active peak assignment with an associated violation of > 0.5 Å when measured on the appropriate reference structure coordinates.
