
Fig. 5. The otic placode is significantly reduced in Notch1 mutants.
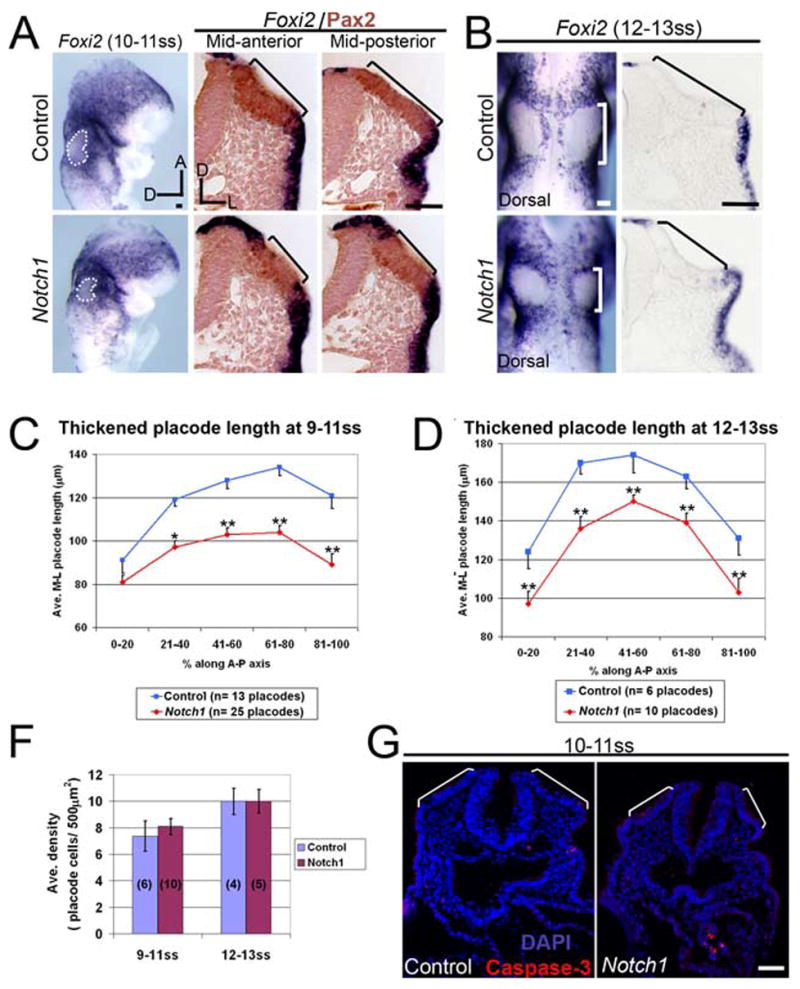
(A–B) Foxi2 expression at 9–11ss (A) and at 12–13ss (B) in whole mounts and sections. Dotted outline/brackets indicate the thickened otic placode region that does not express Foxi2. (A) Corresponding sections showing Foxi2 transcript (blue) and Pax2 protein expression (brown). (C–D) Quantitative comparison of medial-lateral placode length in control and Notch1 mutant embryos at 9–11 somite stage (ss) (C) and 12–13ss (D) (refer to Materials and Methods). (*) p < 0.05 and (**) p < 0.005. (F) Quantitation of average cell density in control and Notch1 mutant. Placode n values in parentheses. (G) Activated Caspase-3 expression (red) indicating lack of apoptotic cells within the Notch1 mutant otic placode at 10–11ss. Bracket: thickened placode. Error bars: SEM. Scale: 50 μm.