Figure 3.
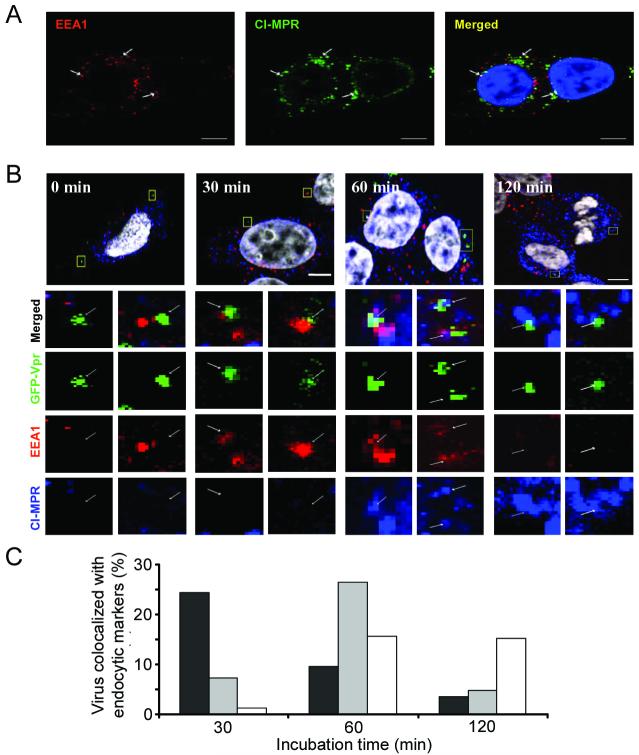
Internalization and transport of viruses through endosomes. (A) Distribution of endocytic compartments in living cells. Early and late endosomes were detected by EEA1 and CI-MPR, respectively. 293T/CD20 cells were immunostained with EEA1 (red) and CI-MPR (green) and counterstained with DAPI (blue). Arrows indicate individual endosomes positive for both early and late endosomal markers. (B) GFP-Vpr-labeled viruses (FUW-GFPVpr/αCD20+SINmu) were incubated with 293T/CD20 cells (MOI ∼30) at 37°C for various time points of 0, 30, 60, or 120 min. Then these cells were fixed, permeabilized, and immunostained with EEA1 (red) and CI-MPR (blue) and counterstained with DAPI (white). The boxed regions are magnified and shown in separated panels below. The bottom panels show the localization of GFP-Vpr-labeled viral particles in the two different endosomal stages. Scale bar represents 5 μm. (C) Quantification of GFP-Vpr-labeled lentiviruses colocalized with EEA1+ (black), CI-MPR+ (white), or EEA1+CI-MPR+ (gray) endosomes at different incubation times. The result shown is the collective data from three experiments.

