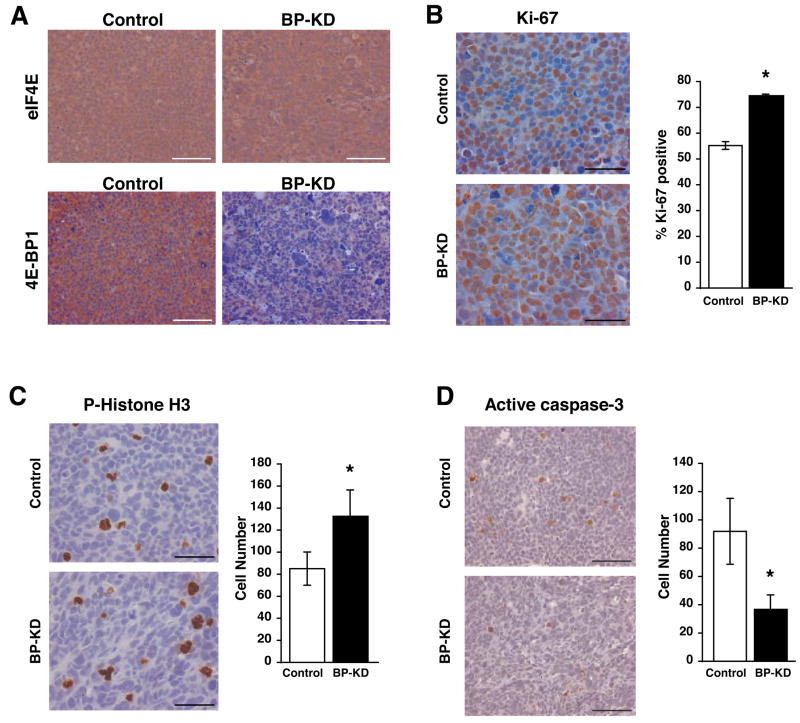
Figure 3.
Analysis of Rh30 xenograft growth. A. IHC staining for eIF4E and 4E-BP1 in control and BP-KD tumor sections. Bar = 100μm. B. IHC performed for Ki-67 positive cells. Ten high power sections were counted from three tumors for each tumor type and average percentage of Ki-67 positive tumors was determined with standard deviation on right. Left, representative IHC stainings, bar = 50μm. * p<0.01. C. IHC with phospho-specific histone H3 (serine 10) performed on control and BP-KD tumors. Six low power sections from three tumors were counted and averages with standard deviation determined, right. Left, representative staining at high power, bar = 50μm. * p<0.05. D. IHC performed for active caspase-3 on control and BP-KD tumors. Ten low power sections were counted from three tumors for each tumor type and the average number of cells with standard deviation is shown on right. Left, high power representative images of stained cells, bar = 100μm. * p<0.05.

