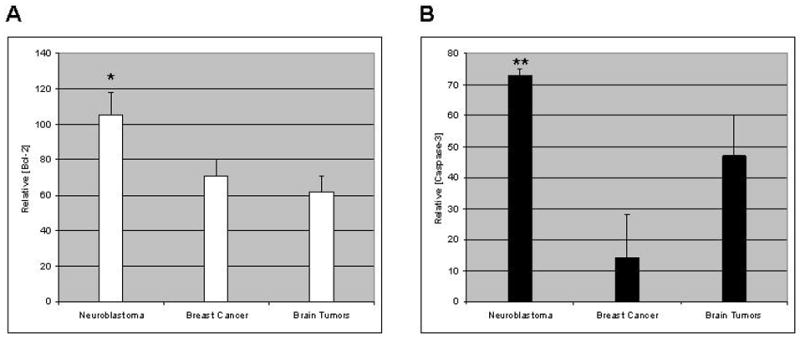
Fig. 2.

Western blot bands obtained for each cell lysate in each of two independent experiments were subjected to optical densitometry and the values for Bcl-2 and caspase-3, respectively, were normalized to the value for β-actin on the same blot. Averages of the results of two independent blots for each cell line were then averaged within tumor type. Results are expressed as relative optical densities (± SEM) for each tumor type. (a) Bcl-2; (b) caspase-3. *Greater than values for breast cancer with p<0.05; **greater than values for breast cancer with p<0.01 (Student’s t-test). Neither Bcl-2 nor caspase-3 content differs significantly between brain and breast cancer.
