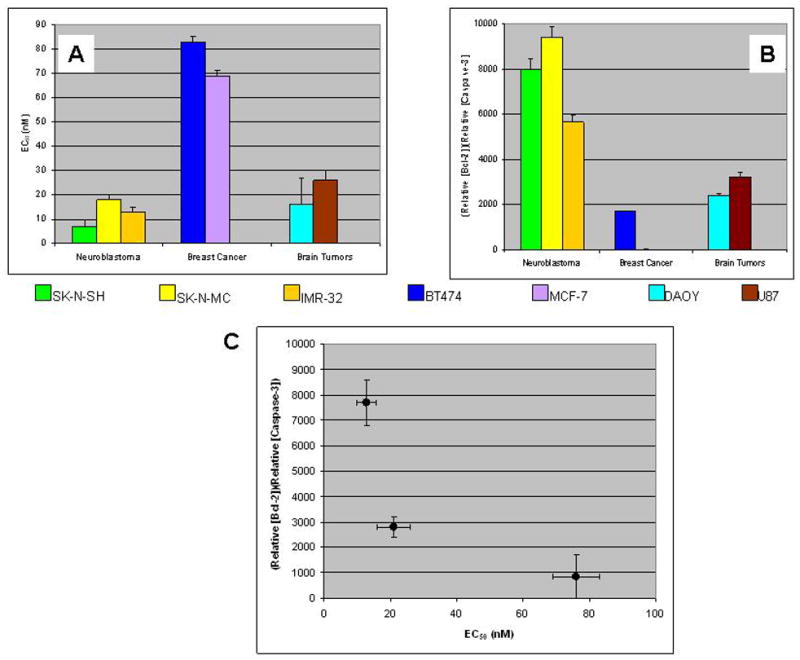
Fig. 4.

EC50 (NCS) (a) and the product of relative caspase-3 content and relative Bcl-2 content (b) displayed by tumor type. (c) Mean (n = 3 for each cell line) EC50 (NCS) versus product of relative caspase-3 content and relative Bcl-2 content (n = 2 for each cell line) for each of three tissues of tumor origin. Error bars denote the SEM. Statistical analysis (Student’s t-test): EC50 (NCS) neuroblastomas < breast cancer, p<0.001; EC50 (NCS) brain tumors < breast cancer, p<0.005; [(relative Bcl-2 content)(relative caspase-3 content)] neuroblastomas > breast cancer, p<0.005; [(relative Bcl-2 content)(relative caspase-3 content)] brain tumors > breast cancer, p=0.05.
