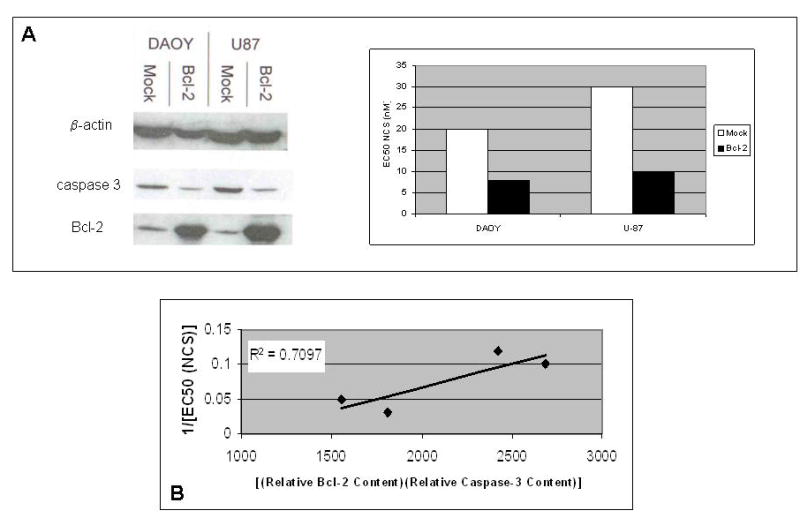
Fig. 5.

(a) Relationship between the product of relative caspase-3 content and relative Bcl-2 content and EC50 (NCS) for native central nervous system cancer cell lines and bcl-2 transfectants of the same cell lines. The Western blot on the left demonstrates the enhanced Bcl-2 content of transfectants relative to their native counterparts. (b) Product of relative Bcl-2 content and relative caspase-3 content versus 1/[EC50 (NCS)] for paired native and bcl-2-transfected central nervous system cancer cell lines. Results of a representative experiment of four performed are shown. R2 was determined by linear regression.
