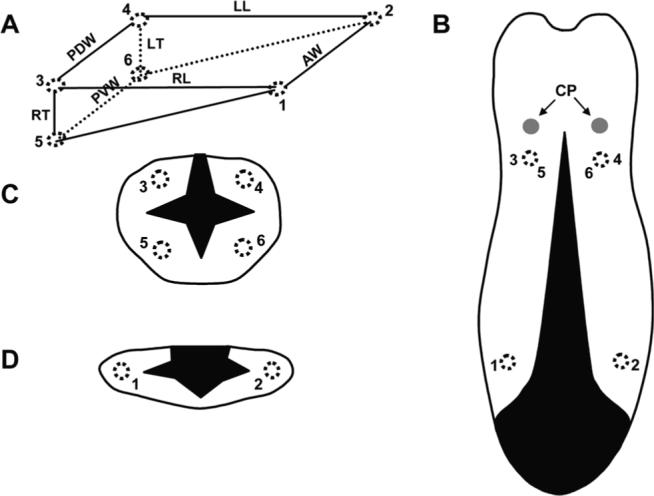
Fig. 1.

Array of six ultrasonic crystals and diagram of tongue volume reduction surgery. A: Wedge-shaped configuration of implanted crystals array. Numbers indicate the location of crystals. #1−2: anterior width (AW); #3−4: posterior dorsal width (PDW); #5−6: posterior ventral width (PVW); #1−3 and #2−4: right and left length (RL and LL); and #3−5 and #4−6: right and left thickness (RT and LT). B: Dorsal view of the tongue. C,D: Cross-sectional views of the posterior and the anterior tongue. Dotted circles indicate implanted crystal sites. Black-shaded areas represent surgical incisions and removed tongue tissue. Arrows indicate two circumvallate papillae (CP).
