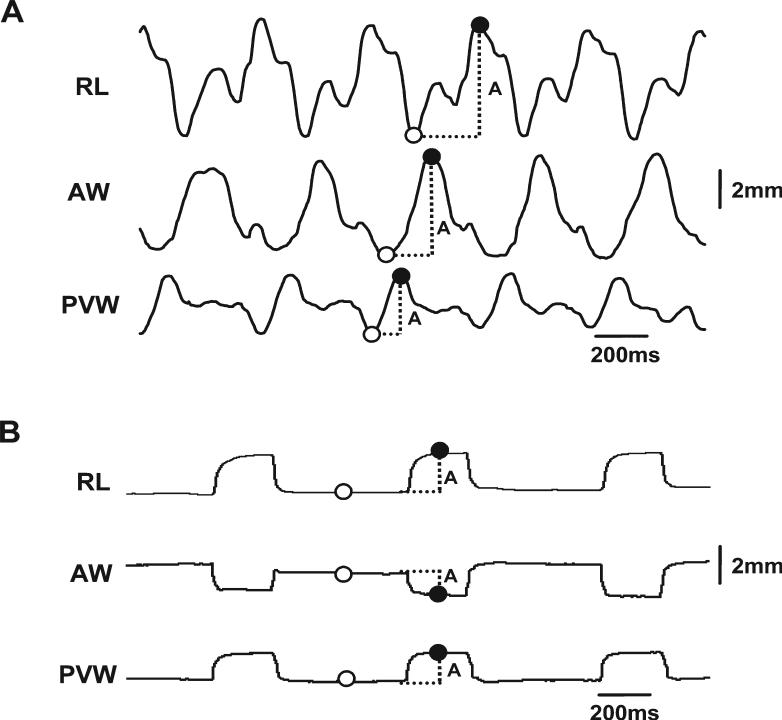
Fig. 3.
Calculation methods for sonomicrometric waves. A: Chewing: five chewing cycles are shown. B: Neuromuscular stimulation: three stimulation pulses are shown. Upward and downward waves indicate increase and decrease of the distance between a given crystal pair (dimensional change), respectively. Solid and empty circles indicate the maximal (peak) and minimal (valley for chewing and baseline for stimulation) values. A, amplitude of dimensional change. Refer to Figure 1 for other captions.

